

Question: MATLAB, Task 4 please and have included code from task 1 and 2. a =2 The CTFT of the sampled signal f(t) is F()=T1n=F(ns)=T1n=F(nT2) where
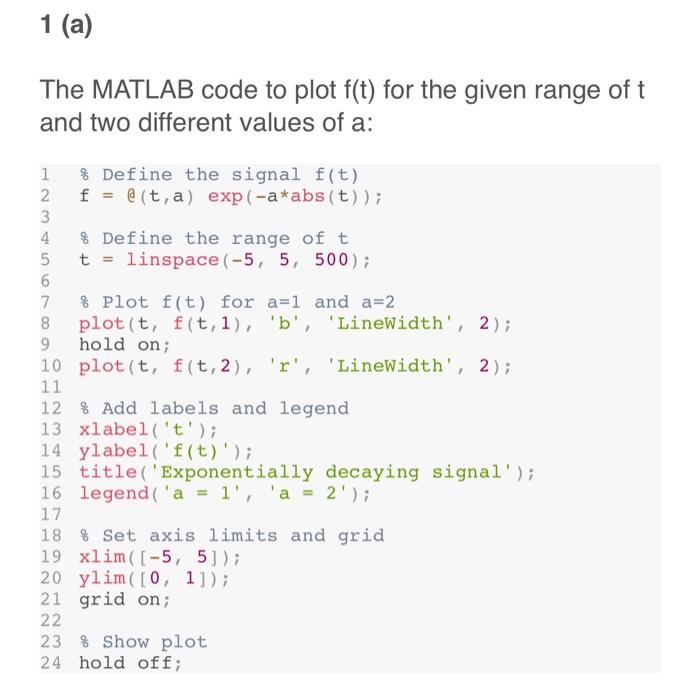
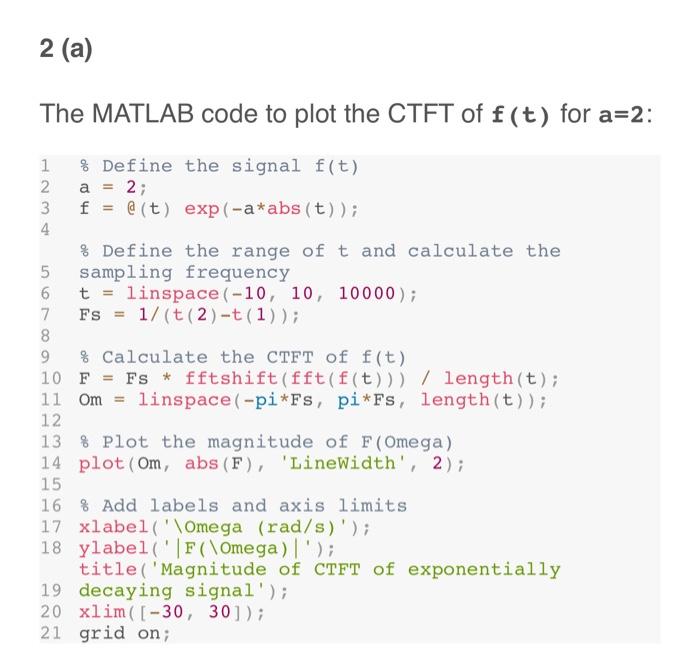
The CTFT of the sampled signal f(t) is F()=T1n=F(ns)=T1n=F(nT2) where s=T2(rad/s). For illustration purposes, we consider an approximation of F^() by limiting the sum above to 11 terms of F(ns) for n=5,4,,0,,4,5. First set T=1 (a) Compute and plot F(). The range for is set to [2s,2s]. On the xlabel, mark the following frequencies: 2s,s,21s,0,21s,s,2s. Include this figure in your final report. From the obtained plot, comment on the periodicity of F(). (b) Limit the range of X-axis of the above plot to [21s,21s] (use xlim command in Matlab). Include this figure in your final report. Compare this plot with the plot of the corresponding F() obtained in Task 2(a) and give your comments. Are you able to recover the original continuous signal in this case and why. (c) Now set T=Tmax, where Tmax is obtained in Task 3 (c). Repeat Task 4( a) and Task 4 (b). Task 3 Sampling Period to Avoid Aliasing [10%] Let f(t) be sampled with a sampling period T (s). The resulting sampled signal is called f(t) in the sequel. (a) Set T=1 and plot f(t) and f(t) in the same figure. Include this figure in your final report. (b) Look at the plot of F() for a=2 obtained in Task 2 and, by visualization, find the frequency at which F() is deemed to be zero. Call this frequency max. (c) Define Tmax=/max and explain why Tmax is defined in this way. (d) Set T=Tmax and plot f(t) and f(t) with with the new sampling period Tmax in the same figure. Include this figure in your final report. How many more samples do you obtain with Tmax, compared to Task 3(a). The MATLAB code to plot f(t) for the given range of t and two different values of a: The MATLAB code to plot the CTFT of f(t) for a=2 : Consider the following exponentially decaying continuous signal: f(t)=eat
Step by Step Solution
There are 3 Steps involved in it

Get step-by-step solutions from verified subject matter experts