

Question: Matlab Task (Write codes in Matlab and provide your plot and results in report) You will use the following dataset given for this hw. The
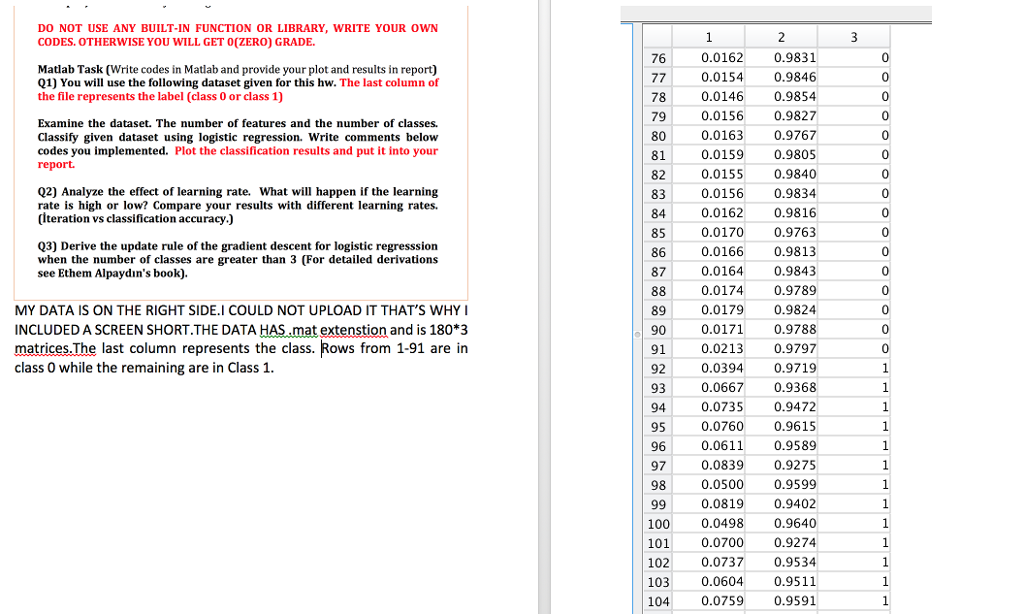
Matlab Task (Write codes in Matlab and provide your plot and results in report) You will use the following dataset given for this hw. The last column o the file represents the label (class 0 or class 1) Examine the dataset. The number of features and the number of classes. Classify given dataset using logistic regression. Write comments below codes you implemented. Plot the classification results and put it into your report. Analyze the effect of learning rate. What will happen if the learning rate is high or low? Compare your results with different learning rates. Derive the update rule of the gradient descent for logistic regression when the number of classes are greater than 3 (For detailed derivations see Ethem Alpaydin's book). Matlab Task (Write codes in Matlab and provide your plot and results in report) You will use the following dataset given for this hw. The last column o the file represents the label (class 0 or class 1) Examine the dataset. The number of features and the number of classes. Classify given dataset using logistic regression. Write comments below codes you implemented. Plot the classification results and put it into your report. Analyze the effect of learning rate. What will happen if the learning rate is high or low? Compare your results with different learning rates. Derive the update rule of the gradient descent for logistic regression when the number of classes are greater than 3 (For detailed derivations see Ethem Alpaydin's book)
Step by Step Solution
There are 3 Steps involved in it

Get step-by-step solutions from verified subject matter experts