

Question: MATLAB The measurement data used in Problems 7 and 8 can also be used to give qualitative assessment. These scores represent ( 2
MATLAB
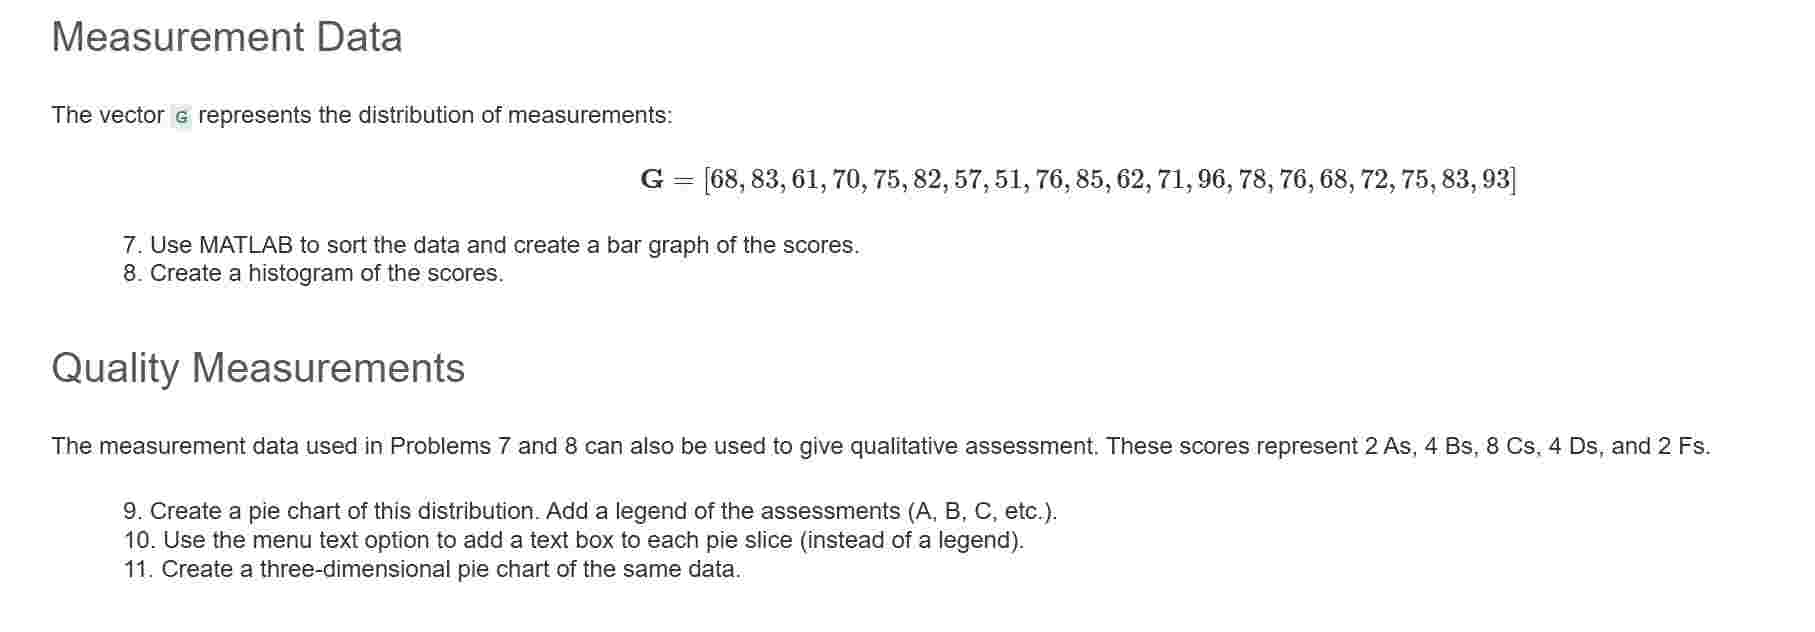
The measurement data used in Problems and can also be used to give qualitative assessment. These scores represent mathrmAsmathrmBsmathrmCsmathrmDs and Fs
Create a pie chart of this distribution. Add a legend of the assessments A B C etc.
Use the menu text option to add a text box to each pie slice instead of a legend
Create a threedimensional pie chart of the same data.
Step by Step Solution
There are 3 Steps involved in it
1 Expert Approved Answer
Step: 1 Unlock

Question Has Been Solved by an Expert!
Get step-by-step solutions from verified subject matter experts
Step: 2 Unlock
Step: 3 Unlock