

Question: MATPLOTLIB This problem will test your ability to use the Python module matplotlib. For this problem, review the part of Section 7 . 1 1
MATPLOTLIB
This problem will test your ability to use the Python module matplotlib. For this problem, review the part of Section labeled Plotting a Bar Graph. Review Programs through for examples of using matplotlib to create a bar graph. The example code provided with the lecture videos will be very useful as well.
Create a file named LabPpy Write a program that helps a user generate a line graph graphic:
a As discussed in the book, you will need to use the Python utility pip to install matplotlib. Follow the instructions in the book for details.
b After your program comment header, add the appropriate line for importing the module matplotlib that makes it convenient to work with the pyplot portion of the module:
import matplotlib.pyplot as plt
c Your program should ask the user to enter a title for a bar graph.
d The program should ask the user for labels for the xaxis and yaxis.
e The program should ask the user for the number of data points.
f Then your program should ask the user for the data point labels and values using a for loop. The labels will be used to label the bar locations on the xaxis. The values will be used to plot the bar heights to the yaxis.
g After collecting the user's input into a list of labels and a list of values, use the appropriate pyplot functions to do the following:
a Create the bar graph.
b Add a title for the chart.
c Add labels for the xaxis and yaxis.
d Display the bar graph.
h The program terminates after the user closes the window displaying the bar graph.
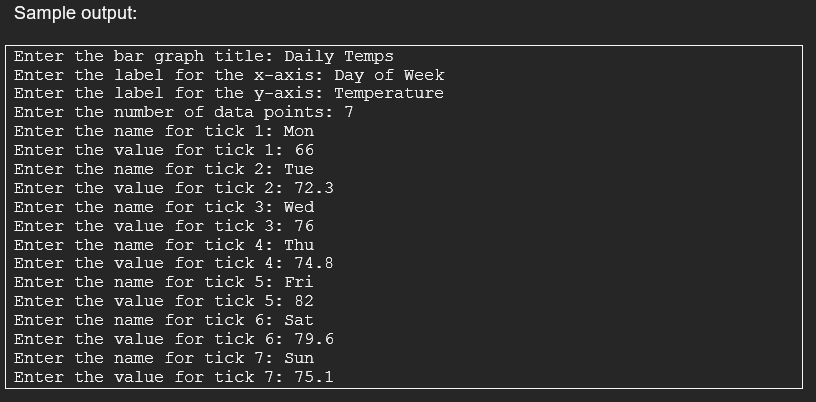
Sample output:
Enter the bar graph title: Daily Temps
Enter the label for the xaxis: Day of Week
Enter the label for the yaxis: Temperature
Enter the number of data points:
Enter the name for tick : Mon
Enter the value for tick :
Enter the name for tick : Tue
Enter the value for tick :
Enter the name for tick : Wed
Enter the value for tick :
Enter the name for tick : Thu
Enter the value for tick :
Enter the name for tick : Fri
Enter the value for tick :
Enter the name for tick : Sat
Enter the value for tick :
Enter the name for tick : Sun
Enter the value for tick :
Run this program. Enter any test data you would like. When your program displays the bar graph, use the save button to save the graph to a file named LabPoutput.png
Step by Step Solution
There are 3 Steps involved in it
1 Expert Approved Answer
Step: 1 Unlock

Question Has Been Solved by an Expert!
Get step-by-step solutions from verified subject matter experts
Step: 2 Unlock
Step: 3 Unlock