

Question: May I get help please, I don't understand the Rstudio. Problem 4: Consider the following data set X given below. Use R to com- pute
May I get help please, I don't understand the Rstudio.
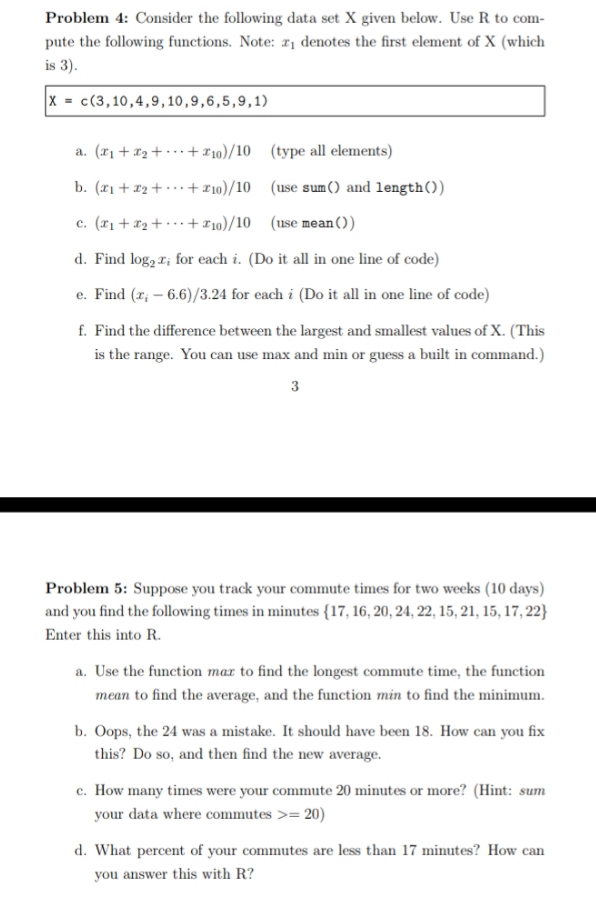
Problem 4: Consider the following data set X given below. Use R to com- pute the following functions. Note: r, denotes the first element of X (which is 3). X = c(3, 10,4,9, 10,9,6,5,9,1) a. (X1 + 12 + . . . + $10)/10 (type all elements) b. (x1 + 12 + . . . + $10)/10 (use sum() and length () ) c. (x1 + 12 + . . . + 10)/10 (use mean()) d. Find log, I; for each i. (Do it all in one line of code) e. Find (r; - 6.6)/3.24 for each i (Do it all in one line of code) f. Find the difference between the largest and smallest values of X. (This is the range. You can use max and min or guess a built in command.) 3 Problem 5: Suppose you track your commute times for two weeks (10 days) and you find the following times in minutes {17, 16, 20, 24, 22, 15, 21, 15, 17, 22} Enter this into R. a. Use the function mar to find the longest commute time, the function mean to find the average, and the function min to find the minimum. b. Oops, the 24 was a mistake. It should have been 18. How can you fix this? Do so, and then find the new average. c. How many times were your commute 20 minutes or more? (Hint: sum your data where commutes >= 20) d. What percent of your commutes are less than 17 minutes? How can you answer this with R
Step by Step Solution
There are 3 Steps involved in it

Get step-by-step solutions from verified subject matter experts