

Question: May I get help with A,B,C,D and E please QUESTION ONE You are investigating the systematic risk for a portfolio using CAPM (Capital Asset Pricing
May I get help with A,B,C,D and E please
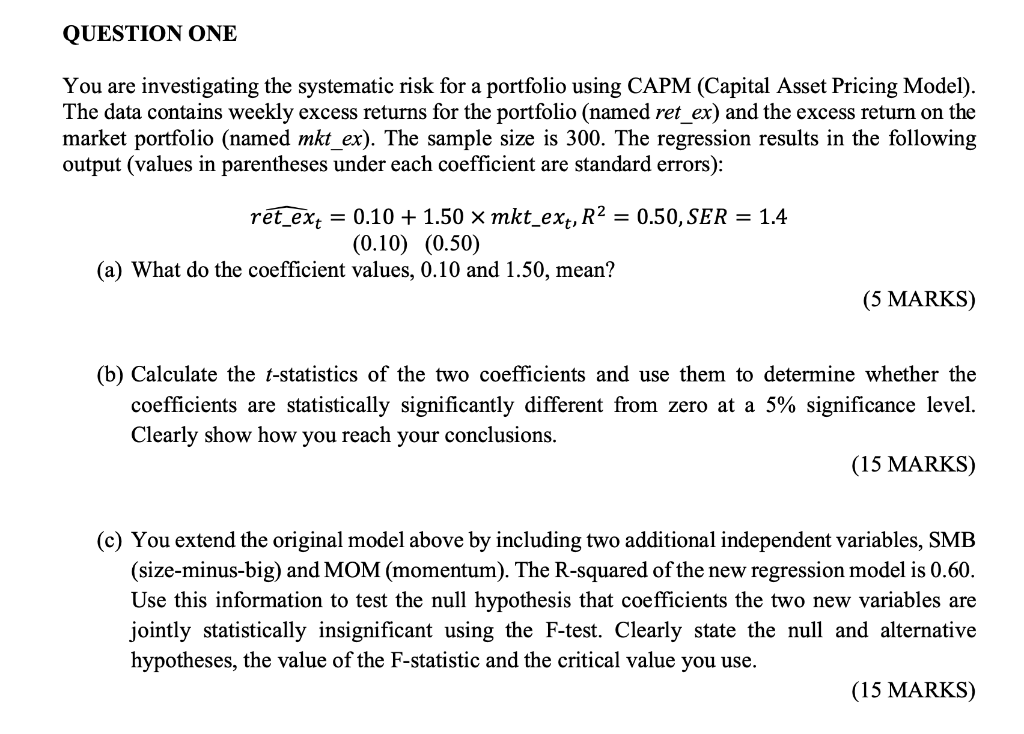
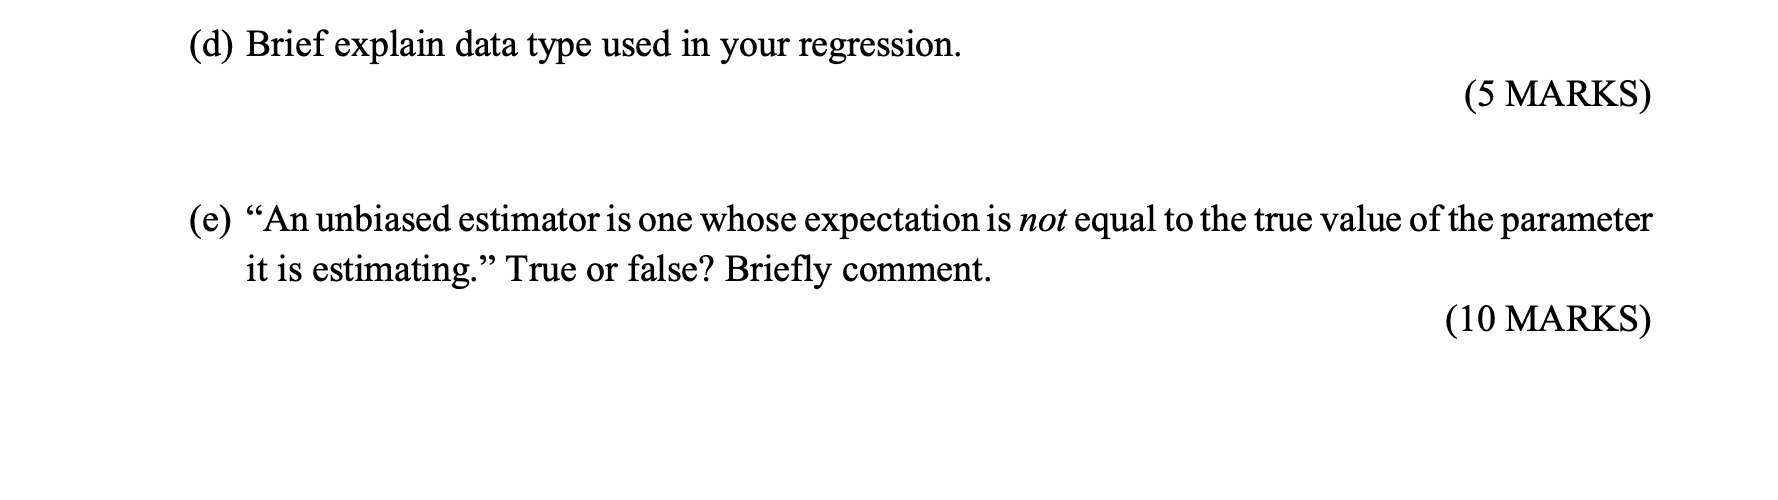
QUESTION ONE You are investigating the systematic risk for a portfolio using CAPM (Capital Asset Pricing Model). The data contains weekly excess returns for the portfolio (named ret_ex) and the excess return on the market portfolio (named mkt_ex). The sample size is 300 . The regression results in the following output (values in parentheses under each coefficient are standard errors): \[ \begin{aligned} r \widehat{e t_{-} e x_{t}}=& 0.10+1.50 \times \text { mkt_}_{-} e x_{t}, R^{2}=0.50, S E R=1.4 \\ &(0.10)(0.50) \end{aligned} \] (a) What do the coefficient values, 0.10 and 1.50, mean? (5 MARKS) (b) Calculate the t-statistics of the two coefficients and use them to determine whether the coefficients are statistically significantly different from zero at a 5% significance level. Clearly show how you reach your conclusions. (15 MARKS) (c) You extend the original model above by including two additional independent variables, SMB (size-minus-big) and MOM (momentum). The R-squared of the new regression model is 0.60. Use this information to test the null hypothesis that coefficients the two new variables are jointly statistically insignificant using the F-test. Clearly state the null and alternative hypotheses, the value of the F-statistic and the critical value you use. (15 MARKS) (d) Brief explain data type used in your regression. (5 MARKS) (e) "An unbiased estimator is one whose expectation is not equal to the true value of the parameter it is estimating." True or false? Briefly comment. (10 MARKS) QUESTION ONE You are investigating the systematic risk for a portfolio using CAPM (Capital Asset Pricing Model). The data contains weekly excess returns for the portfolio (named ret_ex) and the excess return on the market portfolio (named mkt_ex). The sample size is 300 . The regression results in the following output (values in parentheses under each coefficient are standard errors): \[ \begin{aligned} r \widehat{e t_{-} e x_{t}}=& 0.10+1.50 \times \text { mkt_}_{-} e x_{t}, R^{2}=0.50, S E R=1.4 \\ &(0.10)(0.50) \end{aligned} \] (a) What do the coefficient values, 0.10 and 1.50, mean? (5 MARKS) (b) Calculate the t-statistics of the two coefficients and use them to determine whether the coefficients are statistically significantly different from zero at a 5% significance level. Clearly show how you reach your conclusions. (15 MARKS) (c) You extend the original model above by including two additional independent variables, SMB (size-minus-big) and MOM (momentum). The R-squared of the new regression model is 0.60. Use this information to test the null hypothesis that coefficients the two new variables are jointly statistically insignificant using the F-test. Clearly state the null and alternative hypotheses, the value of the F-statistic and the critical value you use. (15 MARKS) (d) Brief explain data type used in your regression. (5 MARKS) (e) "An unbiased estimator is one whose expectation is not equal to the true value of the parameter it is estimating." True or false? Briefly comment. (10 MARKS)
Step by Step Solution
There are 3 Steps involved in it

Get step-by-step solutions from verified subject matter experts