

Question: May I please get help on how to answer this question. In 2015, St. Louis Community College's enrollment data showed the following breakdown of students
May I please get help on how to answer this question.
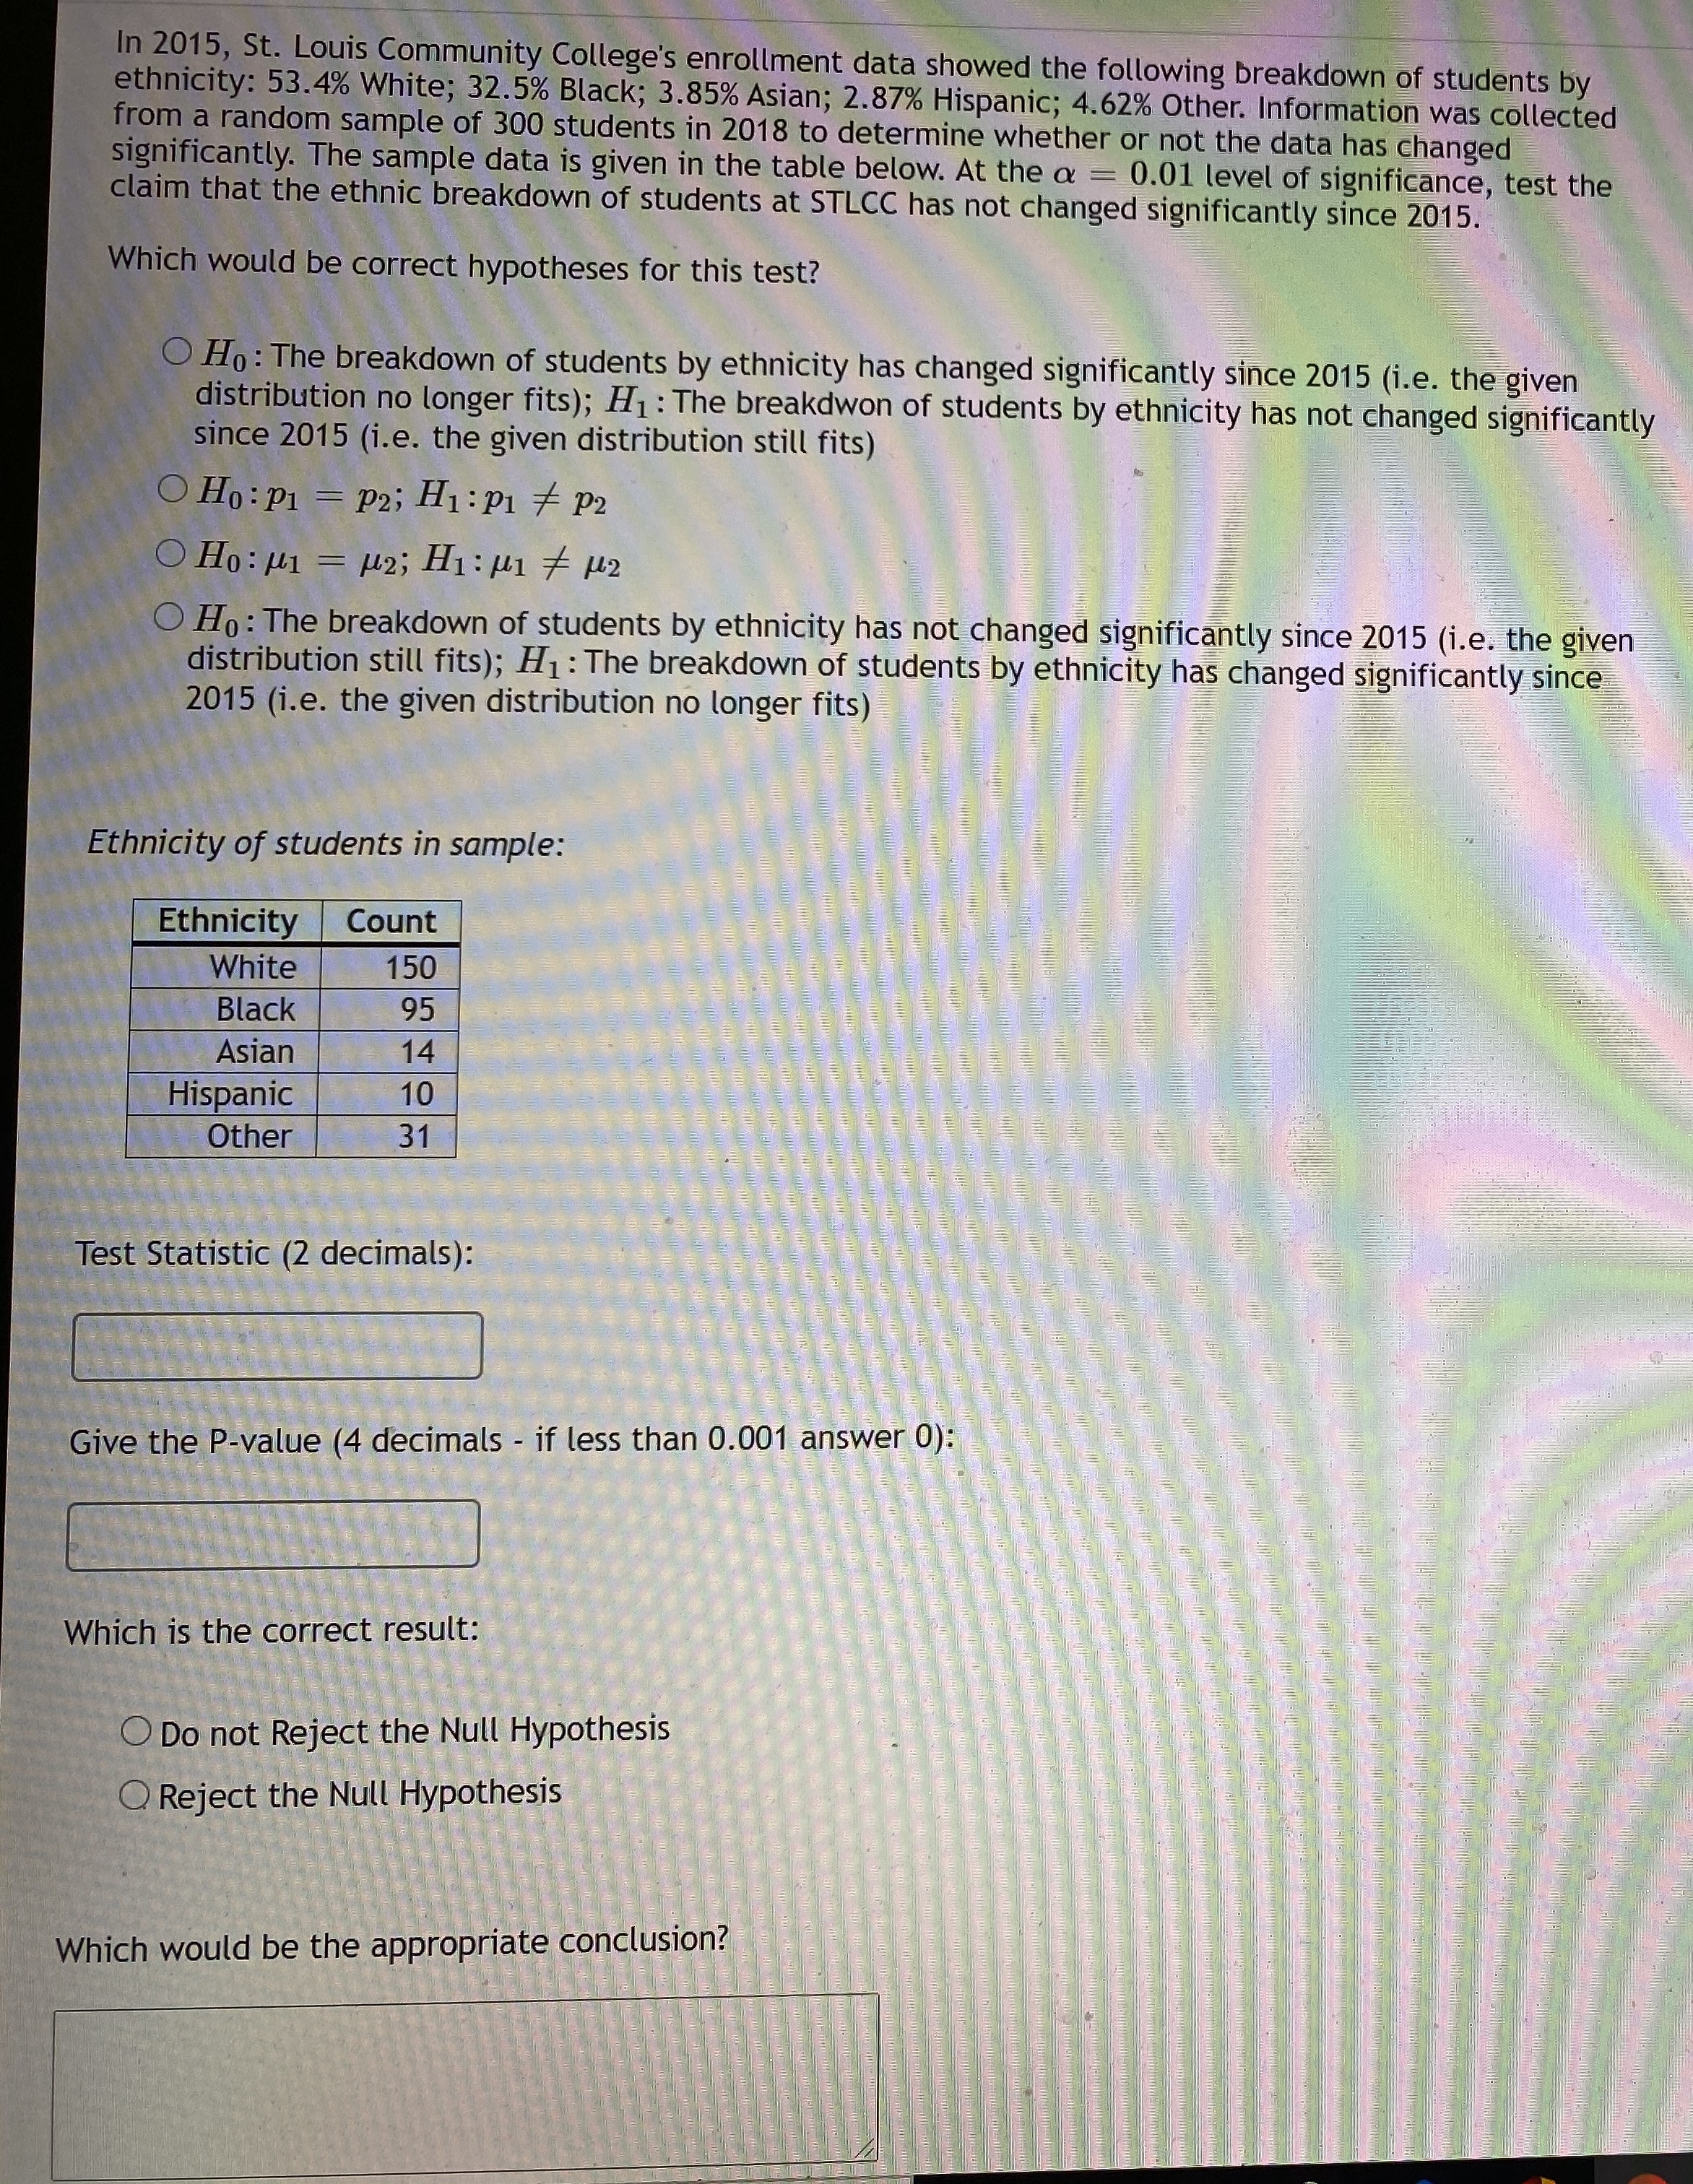
In 2015, St. Louis Community College's enrollment data showed the following breakdown of students by ethnicity: 53.4% White; 32.5% Black; 3.85% Asian; 2.87% Hispanic; 4.62% Other. Information was collected from a random sample of 300 students in 2018 to determine whether or not the data has changed significantly. The sample data is given in the table below. At the a = 0.01 level of significance, test the claim that the ethnic breakdown of students at STLCC has not changed significantly since 2015. Which would be correct hypotheses for this test? O Ho : The breakdown of students by ethnicity has changed significantly since 2015 (i.e. the given distribution no longer fits); H1 : The breakdwon of students by ethnicity has not changed significantly since 2015 (i.e. the given distribution still fits) O Ho : P1 = P2; H1: p1 + P2 O Ho: M1 = M2; H1: M1 + 12 O Ho : The breakdown of students by ethnicity has not changed significantly since 2015 (i.e. the given distribution still fits); H1 : The breakdown of students by ethnicity has changed significantly since 2015 (i.e. the given distribution no longer fits) Ethnicity of students in sample: Ethnicity Count White 150 Black 95 Asian 14 Hispanic 10 Other 31 Test Statistic (2 decimals): Give the P-value (4 decimals - if less than 0.001 answer 0): Which is the correct result: Do not Reject the Null Hypothesis O Reject the Null Hypothesis Which would be the appropriate conclusion
Step by Step Solution
There are 3 Steps involved in it

Get step-by-step solutions from verified subject matter experts