

Question: May you please break down the calculation for the picture below and what do the results mean? This is from a GRR analysis comparing two
May you please break down the calculation for the picture below and what do the results mean? This is from a GRR analysis comparing two hardness tests generated on Minitab.
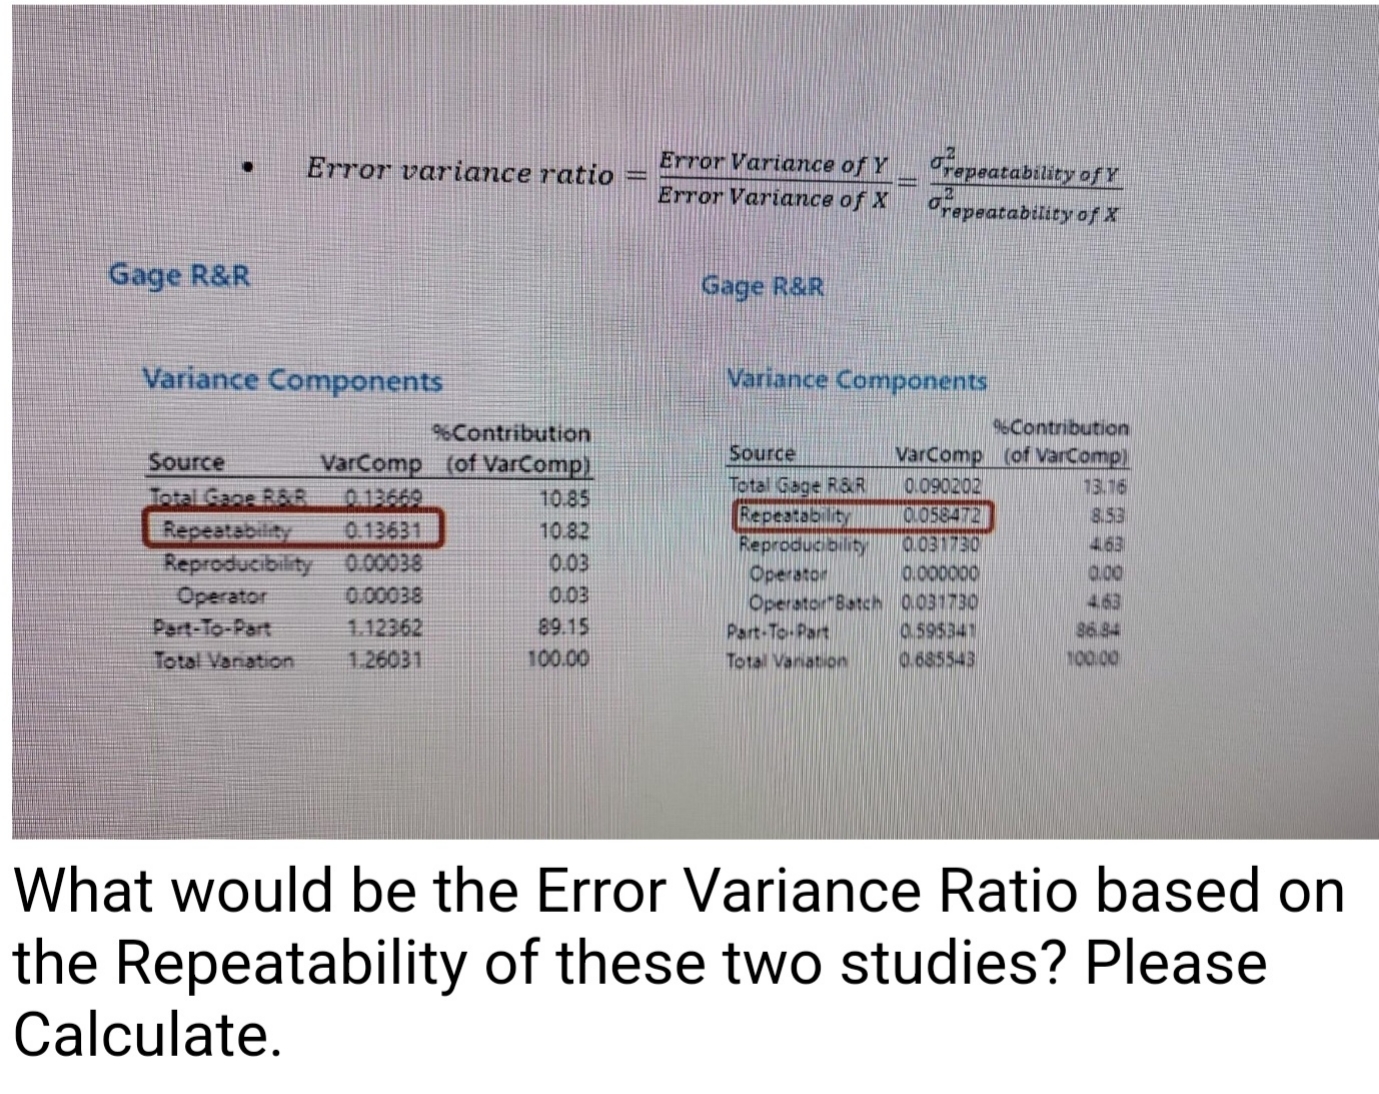
What would be the Error Variance Ratio based on the Repeatability of these two studies? Please Calculate
Step by Step Solution
There are 3 Steps involved in it
1 Expert Approved Answer
Step: 1 Unlock

Question Has Been Solved by an Expert!
Get step-by-step solutions from verified subject matter experts
Step: 2 Unlock
Step: 3 Unlock