

Question: McCullagh and Nelder discuss a log linear model to study the risks of damage in ships according to a number of factors. While the
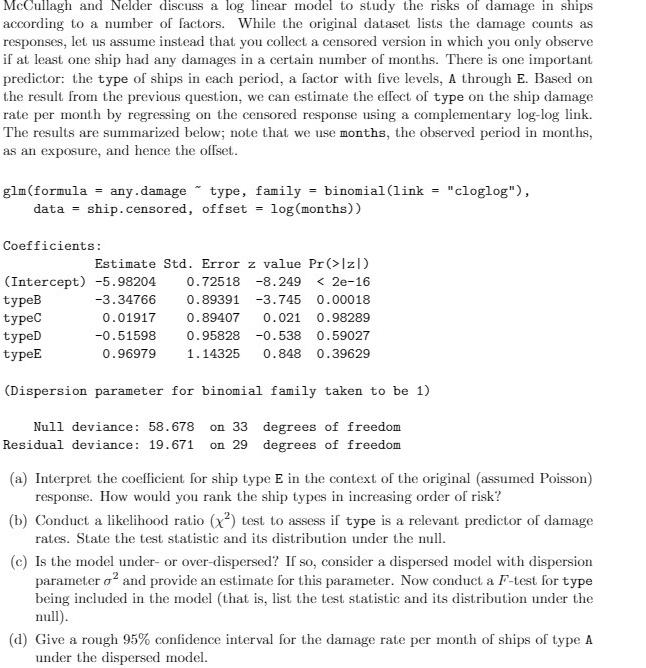
McCullagh and Nelder discuss a log linear model to study the risks of damage in ships according to a number of factors. While the original dataset lists the damage counts as responses, let us assume instead that you collect a censored version in which you only observe if at least one ship had any damages in a certain number of months. There is one important predictor: the type of ships in each period, a factor with five levels, A through E. Based on the result from the previous question, we can estimate the effect of type on the ship damage rate per month by regressing on the censored response using a complementary log-log link. The results are summarized below; note that we use months, the observed period in months, as an exposure, and hence the offset. glm (formula = any.damage type, family = binomial (link = "cloglog"), data ship.censored, offset log (months)) Coefficients: = Estimate Std. Error z value Pr(>[z]) (Intercept) -5.98204 0.72518 -8.249 < 2e-16 typeB -3.34766 0.89391 -3.745 0.00018 typeC 0.01917 0.89407 0.98289 typeD -0.51598 0.021 0.95828 -0.538 0.59027 1.14325 0.848 0.39629 typeE 0.96979 (Dispersion parameter for binomial family taken to be 1) Null deviance: 58.678 on 33 Residual deviance: 19.671 on 29 degrees of freedom degrees of freedom (a) Interpret the coefficient for ship type E in the context of the original (assumed Poisson) response. How would you rank the ship types in increasing order of risk? (b) Conduct a likelihood ratio (x) test to assess if type is a relevant predictor of damage rates. State the test statistic and its distribution under the null. (c) Is the model under- or over-dispersed? If so, consider a dispersed model with dispersion parameter and provide an estimate for this parameter. Now conduct a F-test for type being included in the model (that is, list the test statistic and its distribution under the null). (d) Give a rough 95% confidence interval for the damage rate per month of ships of type A under the dispersed model.
Step by Step Solution
3.40 Rating (159 Votes )
There are 3 Steps involved in it
a The coefficient estimate for ship type E is 096979 This means that the expected log of the probability of at least one ship of type E being damaged in a given month is 096979 units higher than that ... View full answer

Get step-by-step solutions from verified subject matter experts