

Question: MCQ1. The chart below shows the prices on two consecutive days for Wal-Mart, a component stock of the Dow Jones Industrial Average. The chart also
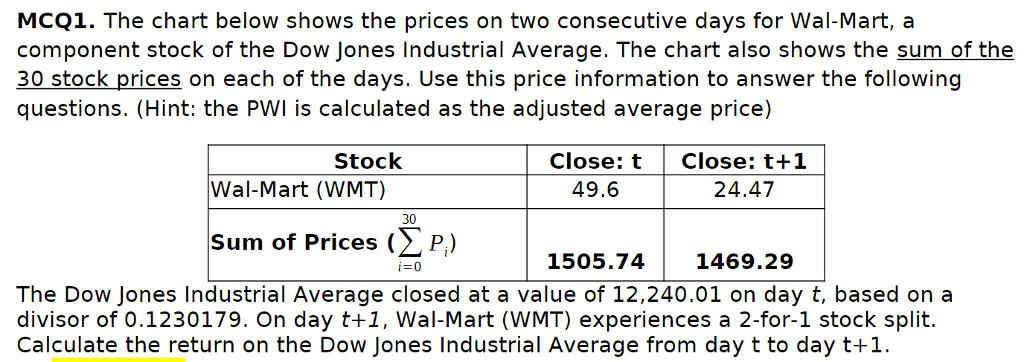
MCQ1. The chart below shows the prices on two consecutive days for Wal-Mart, a component stock of the Dow Jones Industrial Average. The chart also shows the sum of the 30 stock prices on each of the days. Use this price information to answer the following questions. (Hint: the PWI is calculated as the adjusted average price) Stock Close: t Close: t+1 Wal-Mart (WMT) 49.6 24.47 30 sum of Prices ( 1505.74 1469.29 i: 0 The Dow Jones Industrial Average closed at a value of 12,240.01 on day t, based on a divisor of 0.1230179. On day t+1, Wal-Mart (WMT) experiences a 2-for-1 stock split. Calculate the return on the Dow Jones Industrial Average from day t to day t+1
Step by Step Solution
There are 3 Steps involved in it

Get step-by-step solutions from verified subject matter experts