

Question: md with well shown graphs.. explain your answers 4 Section B Answer one question. 2 (a) Explain, with the help of diagrams, how (i) constant

![economy's production possibility curve. [8] (b) Discuss what the most significant issues](https://s3.amazonaws.com/si.experts.images/answers/2024/06/6669c82c39f0c_5566669c82c177c2.jpg)
![a planned economy to a mixed economy. [12] 3 (a) Explain, with](https://s3.amazonaws.com/si.experts.images/answers/2024/06/6669c82d941be_5576669c82d65f7f.jpg)
![maximum price in a market for an essential food item. [8] (b)](https://s3.amazonaws.com/si.experts.images/answers/2024/06/6669c82e37ec8_5586669c82e26ee0.jpg)
md with well shown graphs.. explain your answers

![disadvantages. [12] 4 (a) Explain, with the help of a diagram(s), how](https://s3.amazonaws.com/si.experts.images/answers/2024/06/6669c82ee3c88_5586669c82ecf93d.jpg)
![economy. [8] (b) Discuss whether deflation is more of a problem in](https://s3.amazonaws.com/si.experts.images/answers/2024/06/6669c82fb1274_5596669c82f91ccb.jpg)
![an economy than inflation. [12]2 1 When can an economy be said](https://s3.amazonaws.com/si.experts.images/answers/2024/06/6669c83024a0b_5596669c82fde4a1.jpg)
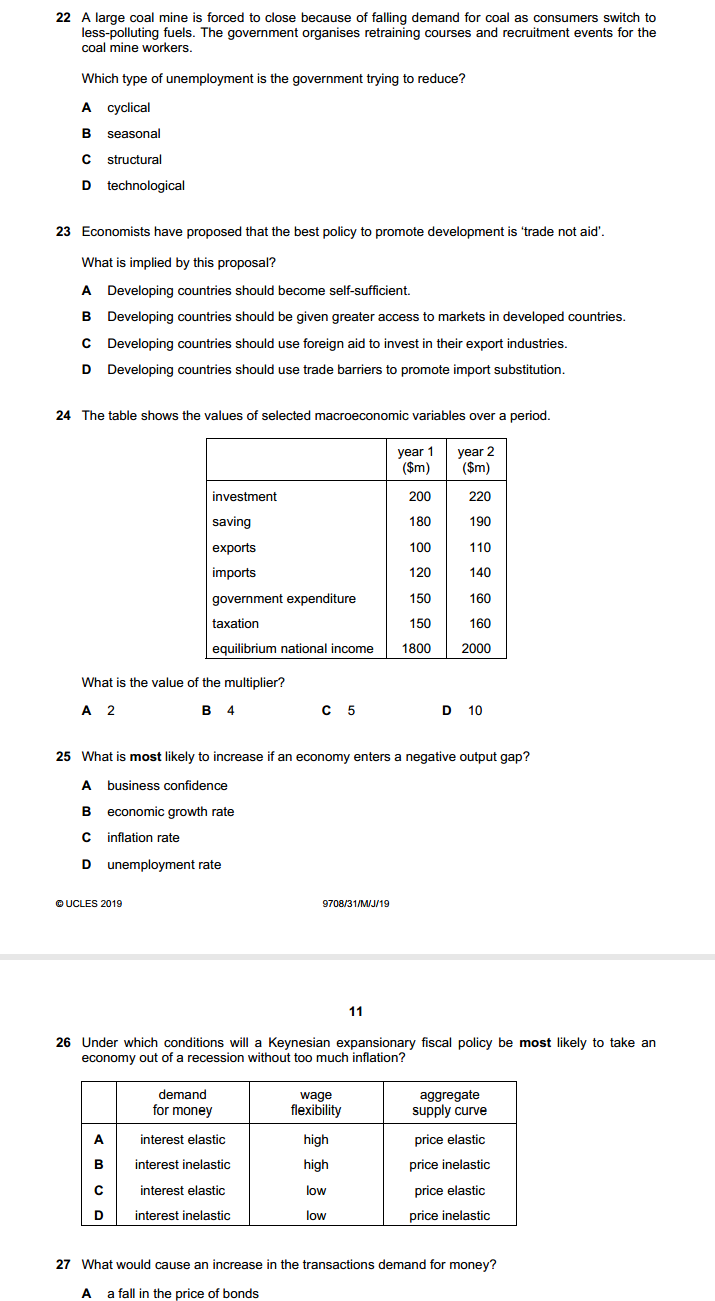

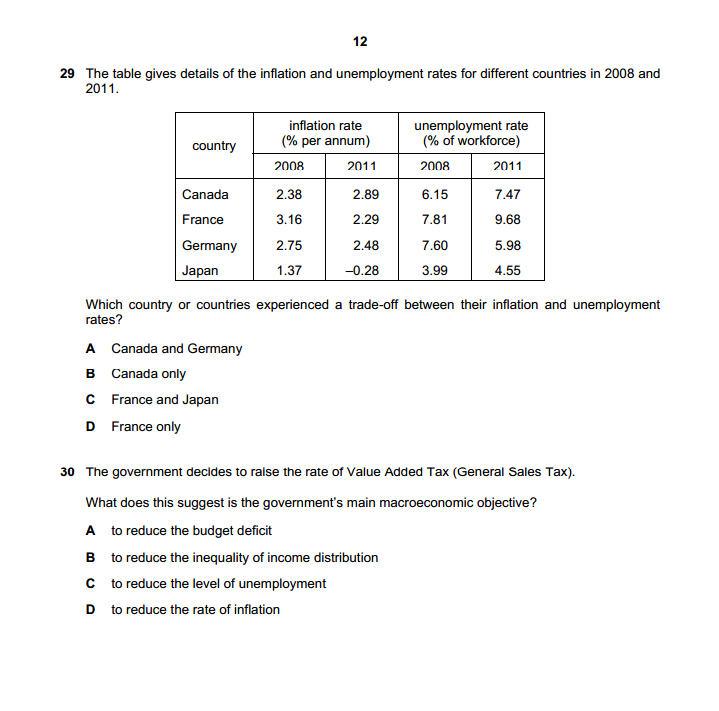
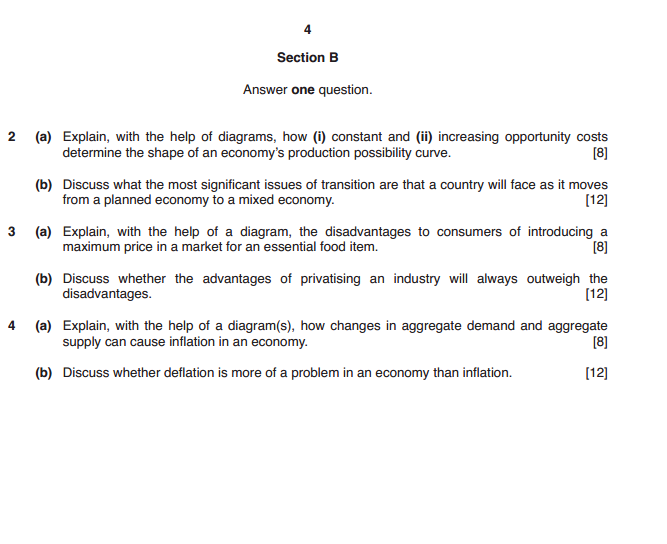
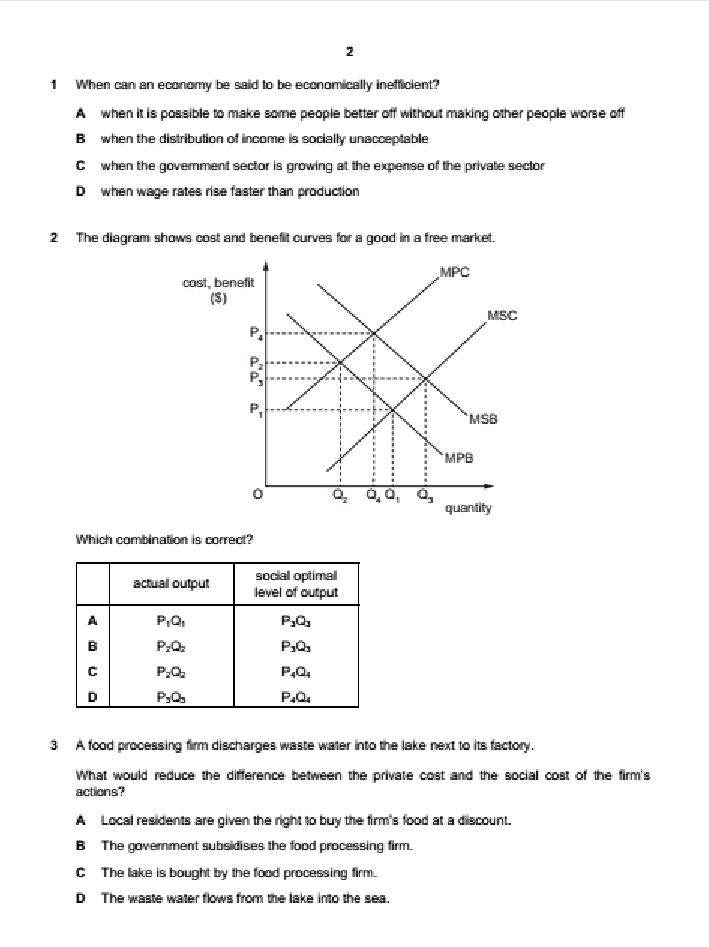
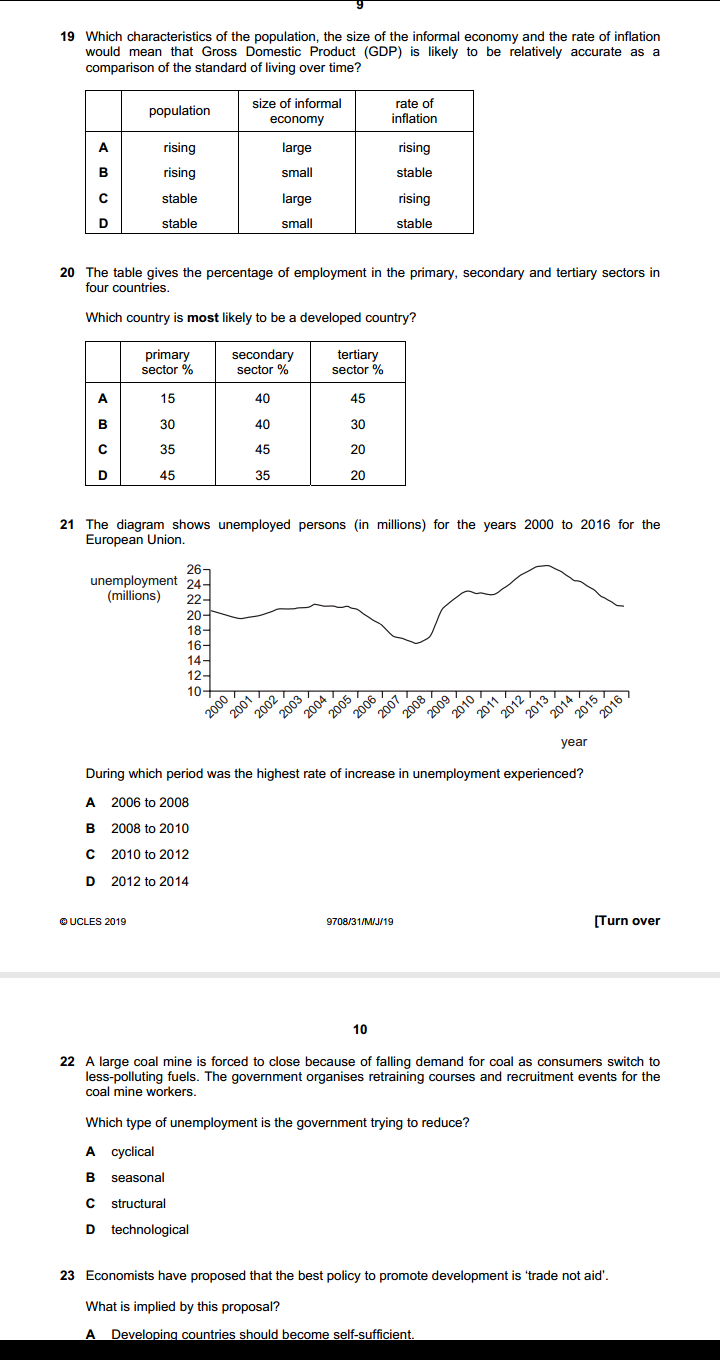
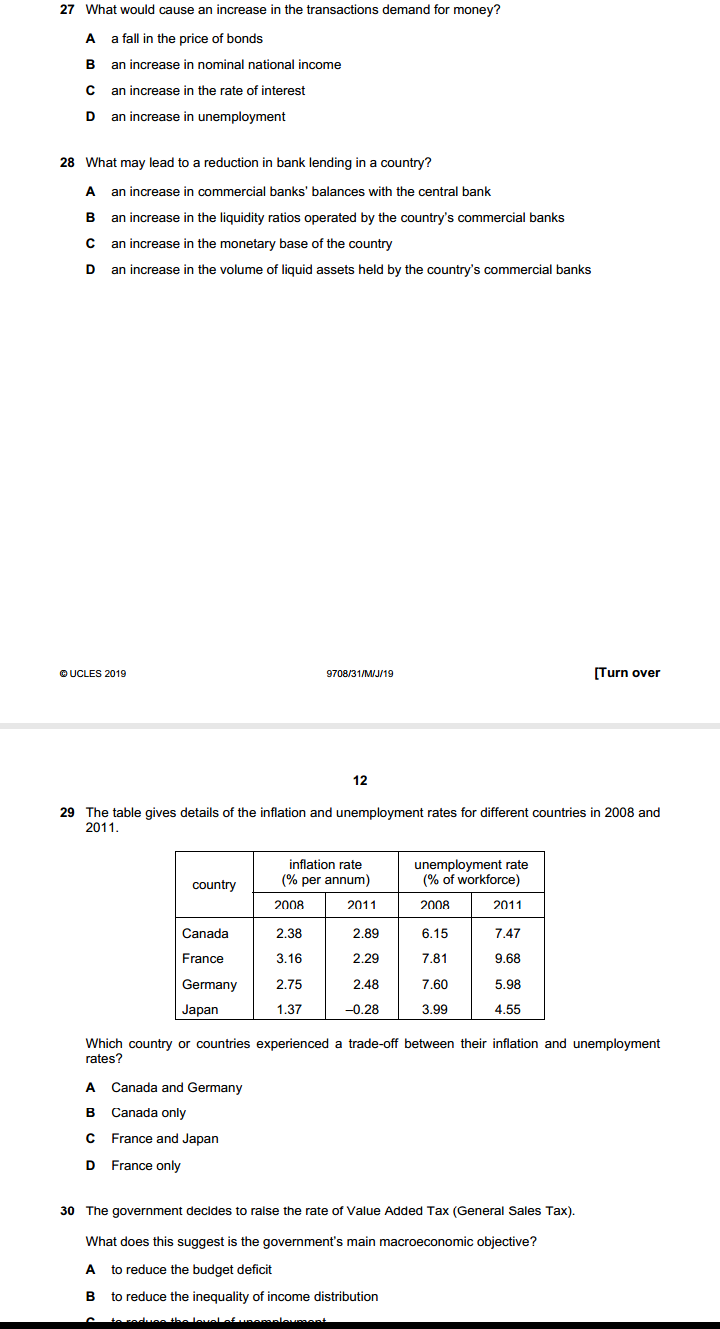
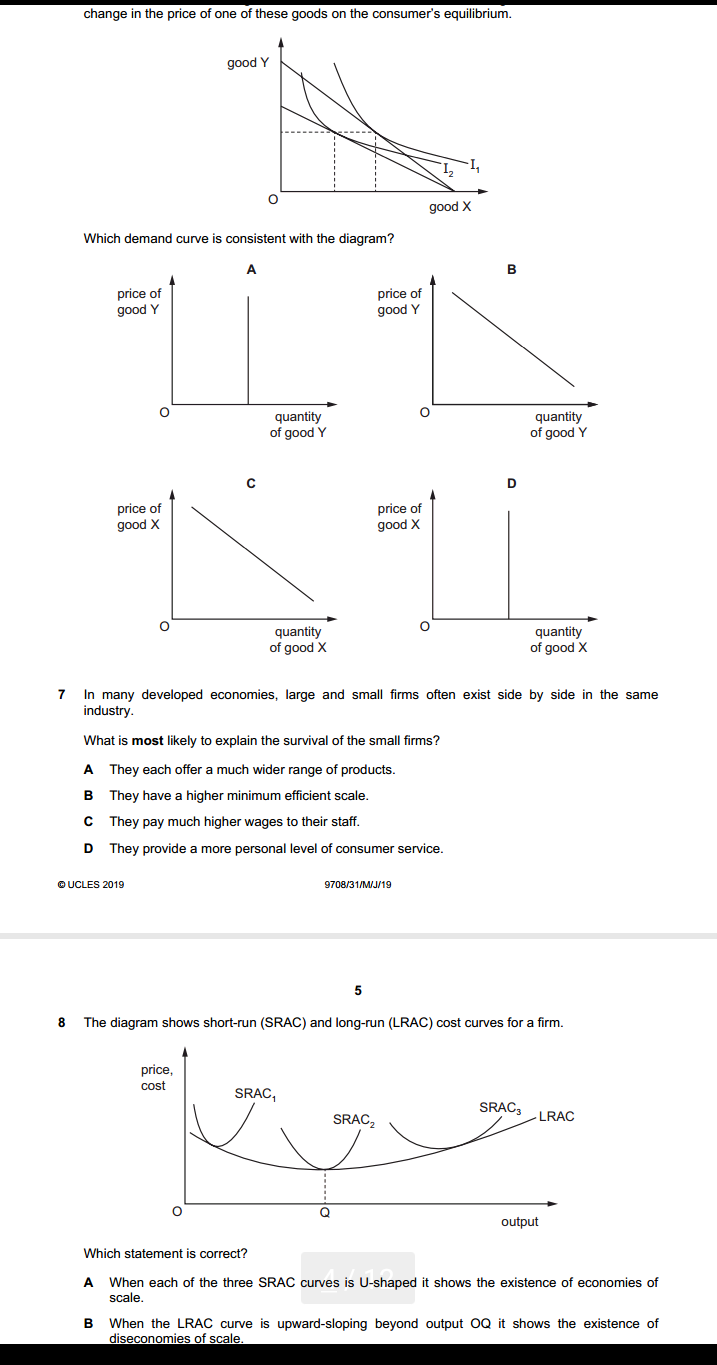
4 Section B Answer one question. 2 (a) Explain, with the help of diagrams, how (i) constant and (ii) increasing opportunity costs determine the shape of an economy's production possibility curve. [8] (b) Discuss what the most significant issues of transition are that a country will face as it moves from a planned economy to a mixed economy. [12] 3 (a) Explain, with the help of a diagram, the disadvantages to consumers of introducing a maximum price in a market for an essential food item. [8] (b) Discuss whether the advantages of privatising an industry will always outweigh the disadvantages. [12] 4 (a) Explain, with the help of a diagram(s), how changes in aggregate demand and aggregate supply can cause inflation in an economy. [8] (b) Discuss whether deflation is more of a problem in an economy than inflation. [12]2 1 When can an economy be said to be economically inefficient? A when it is possible to make some people better off without making other people worse off B when the distribution of income is socially unacceptable C when the goverment sector is growing at the expense of the private sector when wage rates rise faster than production 2 The diagram shows cost and benefit curves for a good in a free market. cost, benefit (5) MSC PA P 0 quantity Which combination is correct? actual output social optimal level of output A P.Q P,Q. P.Q. P.O. 3 A food processing firm discharges waste water into the lake next to its factory. What would reduce the difference between the private cost and the social cost of the firm's actions? A Local residents are given the right to buy the firm's food at a discount. B The government subsidises the food processing firm. C The lake is bought by the food processing firm. D The waste water flows from the lake into the sea.change in the price of one of these goods on the consumer's equilibrium. good '1' 0 Which demand curve is consistent with the diagram? A B price of price of good Y good '4' 0 quantity 0 quantity of good Y of good Y C D price of price of good X good X 0 quantity 0 quantity of good X of good X T In many developed economies, large and small rms often exist side by side in the same industry. \"that is most likely to explain the survival of the small rms? A They each offer a much wider range of products. B They have a higher minimum efcient scale. I: They pay much higher wages to their staff. D They provide a more personal level of consumer service. GUCLES 21319 97m1MJI19 B The diagram shows shortrun (SEAS) and longrun [LRAC) cost curves for a rm. SRAC 5mg? 3 LRAC O Q output Which statement is correct? A When each of the three SRAC curves is Ushaped it shows the existence of economies of scale. B When the LRAC curve is upwardsloping beyond output 00 it shows the existence of diseconomies of scale; 9 What is most likely to rise as a rm expands? In the long mm. what is a feature of monopolistic competition. but not of perfect competition? A. energy costs per unit of output B the cost of components 6 the cost of monitoring workers D the rate of interest paid on borrowing 1 ll A a small number of buyers B product differentiation 6 the existence of abnormal prots D the existence of barriers to entry e ucLEs 2mg QTCBI'Q'lMJJ' 19 6 [Turn over 11 A small European airiine currentjy produces at point X on its longrun average cost curve. It wants a bigger share of the European airline market and proposes to merge with another small European airline. The newly merged rm would produce at point Y on the Iongrmn average cost curve, as shown. 12 costs 0 LRAC output Why might the newly merged rm be able to produce at point Y? ODD)!- Arm sells its product to consumers in two separate markets, M and N. The new airiine can negotiate discounts when buying fuel. The new airline has many layers of management The new airline is unable to hire enough pilots. The workforce of the new airline lacks morale and is demotivated. Under which conditions will a policy of price discrimination between the two markets be most protable for the rm? price elasticity price elasticity geographic-I of demand in of demand in distance between market M market N markets M and N A 1.2 1.2 large B 1.2 1.2 small 0 1.3 1.2 large D 1.3 1.2 small 19 Which characteristics of the population, the size of the informal economy and the rate of inflation would mean that Gross Domestic Product (GDP) is likely to be relatively accurate as a comparison of the standard of living over time? population size of informal rate of economy inflation A rising large rising B rising small stable C stable large rising stable small stable 20 The table gives the percentage of employment in the primary, secondary and tertiary sectors in four countries. Which country is most likely to be a developed country? primary secondary tertiary sector % sector % sector % A 15 40 45 B 30 40 30 35 45 20 D 45 35 20 21 The diagram shows unemployed persons (in millions) for the years 2000 to 2016 for the European Union. 26- unemployment 24- (millions) 22- 20- 18- 16- 14- 12- 10- 2000 2001 2002 2003 2004 2005 2006 2007 2008 2009 2010 2011 2012 > 2013 2014 2015 2016 year During which period was the highest rate of increase in unemployment experienced? A 2006 to 2008 B 2008 to 2010 C 2010 to 2012 D 2012 to 2014 @ UCLES 2019 9708/31/M/J/19 [Turn over 10 22 A large coal mine is forced to close because of falling demand for coal as consumers switch to less-polluting fuels. The government organises retraining courses and recruitment events for the coal mine workers. Which type of unemployment is the government trying to reduce? A cyclical B seasonal C structural D technological 23 Economists have proposed that the best policy to promote development is 'trade not aid'. What is implied by this proposal? Developing countries should become self-sufficient22 A large coal mine is forced to close because of falling demand for coal as consumers switch to less-polluting fuels. The government organises retraining courses and recruitment events for the coal mine workers. Which type of unemployment is the government trying to reduce? A cyclical B seasonal C structural D technological 23 Economists have proposed that the best policy to promote development is 'trade not aid'. What is implied by this proposal? A Developing countries should become self-sufficient. B Developing countries should be given greater access to markets in developed countries. C Developing countries should use foreign aid to invest in their export industries. D Developing countries should use trade barriers to promote import substitution. 24 The table shows the values of selected macroeconomic variables over a period. year 1 year 2 ($m) ($m) investment 200 220 saving 180 190 exports 100 110 imports 120 140 government expenditure 150 160 taxation 150 160 equilibrium national income 1800 2000 What is the value of the multiplier? A 2 B C 5 D 10 25 What is most likely to increase if an economy enters a negative output gap? A business confidence B economic growth rate C inflation rate D unemployment rate UCLES 2019 9708/31/M/J/19 11 26 Under which conditions will a Keynesian expansionary fiscal policy be most likely to take an economy out of a recession without too much inflation? demand wage aggregate for money flexibility supply curve D interest elastic high price elastic interest inelastic high price inelastic interest elastic low price elastic interest inelastic low price inelastic 27 What would cause an increase in the transactions demand for money? a fall in the price of bonds27 What would cause an increase in the transactions demand for money? A a fall in the price of bonds B an increase in nominal national income C an increase in the rate of interest D an increase in unemployment 28 What may lead to a reduction in bank lending in a country? A an increase in commercial banks' balances with the central bank B an increase in the liquidity ratios operated by the country's commercial banks C an increase in the monetary base of the country D an increase in the volume of liquid assets held by the country's commercial banks DUCLES 2019 9708/31/M/J/19 [Turn over 12 29 The table gives details of the inflation and unemployment rates for different countries in 2008 and 2011. inflation rate unemployment rate country % per annum) % of workforce) 2008 2011 2008 2011 Canada 2.38 2.89 6.15 7.47 France 3.16 2.29 7.81 9.68 Germany 2.75 2.48 7.60 5.98 Japan 1.37 -0.28 3.99 4.55 Which country or countries experienced a trade-off between their inflation and unemployment rates? A Canada and Germany Canada only C France and Japan D France only 30 The government decides to raise the rate of Value Added Tax (General Sales Tax). What does this suggest is the government's main macroeconomic objective? A to reduce the budget deficit B to reduce the inequality of income distribution12 29 The table gives details of the inflation and unemployment rates for different countries in 2008 and 2011. inflation rate unemployment rate country (% per annum) (% of workforce) 2008 201 1 2008 2011 Canada 2.38 2.89 6.15 7.47 France 3.16 2.29 7.81 9.68 Germany 2.75 2.48 7.60 5.98 Japan 1.37 -0.28 3.99 4.55 Which country or countries experienced a trade-off between their inflation and unemployment rates? A Canada and Germany B Canada only C France and Japan D France only 30 The government decides to raise the rate of Value Added Tax (General Sales Tax). What does this suggest is the government's main macroeconomic objective? A to reduce the budget deficit B to reduce the inequality of income distribution C to reduce the level of unemployment D to reduce the rate of inflation
Step by Step Solution
There are 3 Steps involved in it

Get step-by-step solutions from verified subject matter experts