

Question: MDM4U One-Variable Data Analysis Name: Date: Assignment: SWEET STATISTICS You have two packs of Smarties chocolates with Smarties of different colours. 1. In the Frequency
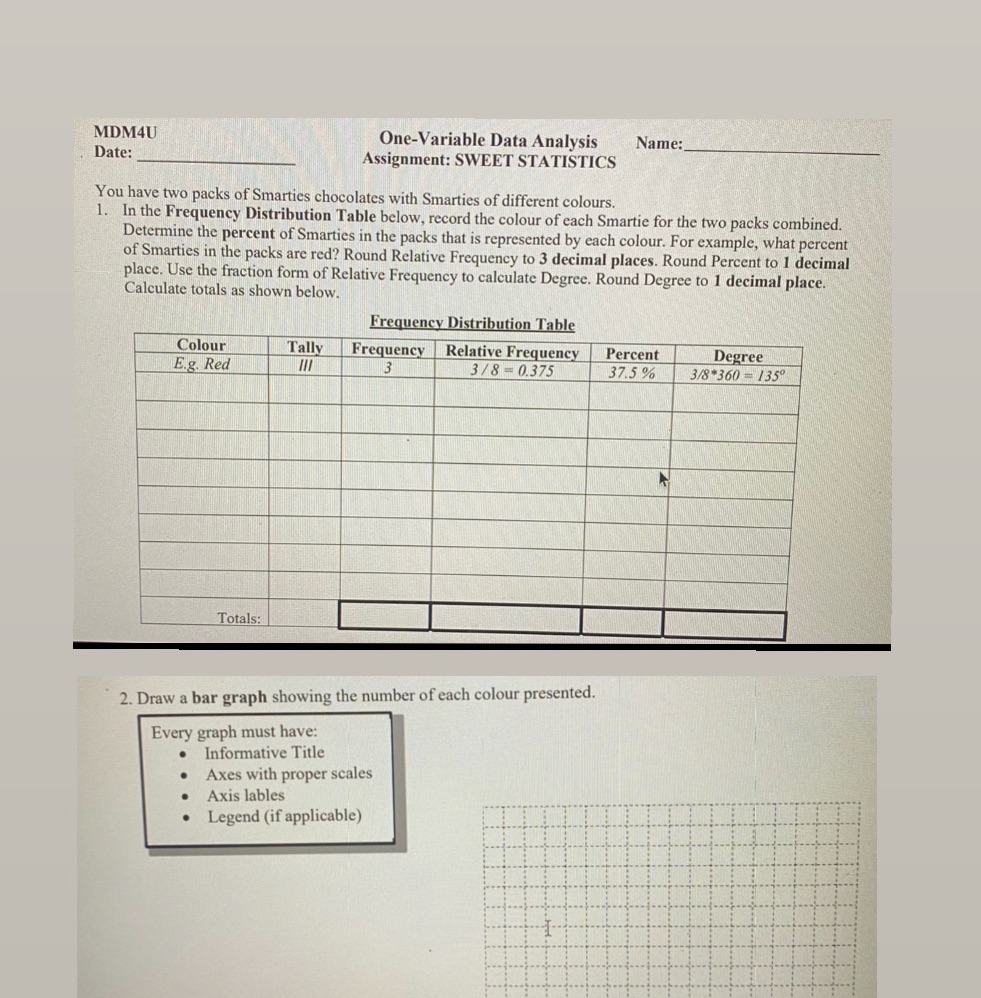
MDM4U One-Variable Data Analysis Name: Date: Assignment: SWEET STATISTICS You have two packs of Smarties chocolates with Smarties of different colours. 1. In the Frequency Distribution Table below, record the colour of each Smartie for the two packs combined. Determine the percent of Smarties in the packs that is represented by each colour. For example, what percent of Smarties in the packs are red? Round Relative Frequency to 3 decimal places. Round Percent to 1 decimal place. Use the fraction form of Relative Frequency to calculate Degree. Round Degree to 1 decimal place. Calculate totals as shown below. Frequency Distribution Table Colour Tally Frequency Relative Frequency Percent Degree E.g. Red 111 3/8 - 0.375 37.5% 3/8 360 - 1350 Totals: 2. Draw a bar graph showing the number of each colour presented. Every graph must have: Informative Title Axes with proper scales . Axis lables . Legend (if applicable)
Step by Step Solution
There are 3 Steps involved in it

Get step-by-step solutions from verified subject matter experts