ME - myUFV Apple Disney Yahoo! SUPPLY AND DEMAND ACTIVITY SELLING PRICE $1.00 $2.00 $4.00 Zimbra:...
Fantastic news! We've Found the answer you've been seeking!
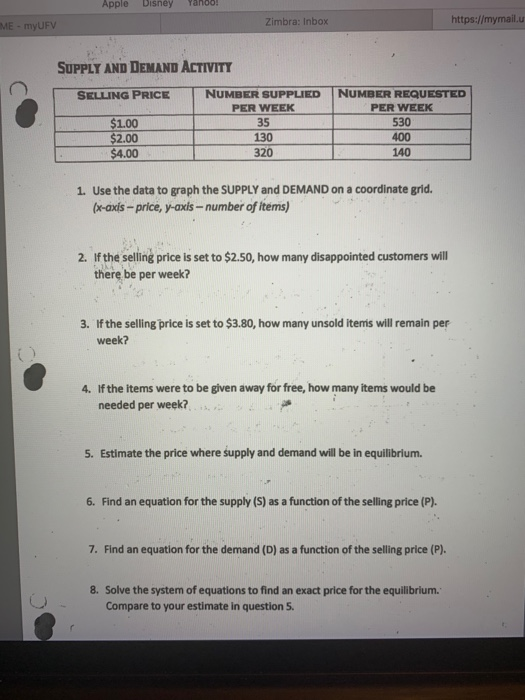
Question:
Transcribed Image Text:
ME - myUFV Apple Disney Yahoo! SUPPLY AND DEMAND ACTIVITY SELLING PRICE $1.00 $2.00 $4.00 Zimbra: Inbox NUMBER SUPPLIED PER WEEK 35 130 320 NUMBER REQUESTED PER WEEK 530 400 140 1. Use the data to graph the SUPPLY and DEMAND on a coordinate grid. (x-axis-price, y-axis-number of items) 2. If the selling price is set to $2.50, how many disappointed customers will there be per week? 3. If the selling price is set to $3.80, how many unsold items will remain per week? 4. If the items were to be given away for free, how many items would be needed per week? 5. Estimate the price where supply and demand will be in equilibrium. 6. Find an equation for the supply (S) as a function of the selling price (P). 7. Find an equation for the demand (D) as a function of the selling price (P). https://mymail.u 8. Solve the system of equations to find an exact price for the equilibrium. Compare to your estimate in question 5. ME - myUFV Apple Disney Yahoo! SUPPLY AND DEMAND ACTIVITY SELLING PRICE $1.00 $2.00 $4.00 Zimbra: Inbox NUMBER SUPPLIED PER WEEK 35 130 320 NUMBER REQUESTED PER WEEK 530 400 140 1. Use the data to graph the SUPPLY and DEMAND on a coordinate grid. (x-axis-price, y-axis-number of items) 2. If the selling price is set to $2.50, how many disappointed customers will there be per week? 3. If the selling price is set to $3.80, how many unsold items will remain per week? 4. If the items were to be given away for free, how many items would be needed per week? 5. Estimate the price where supply and demand will be in equilibrium. 6. Find an equation for the supply (S) as a function of the selling price (P). 7. Find an equation for the demand (D) as a function of the selling price (P). https://mymail.u 8. Solve the system of equations to find an exact price for the equilibrium. Compare to your estimate in question 5.
Expert Answer:
Answer rating: 100% (QA)
To solve these questions well start by plotting the supply and demand data on a graph Then well use ... View the full answer
Related Book For
Statistics Unlocking The Power Of Data
ISBN: 9780470601877
1st Edition
Authors: Robin H. Lock, Patti Frazer Lock, Kari Lock Morgan, Eric F. Lock, Dennis F. Lock
Posted Date:
Students also viewed these accounting questions
-
The table shows some properties of four elements. Use the data to answer the following questions. (Assume that steel has similar properties to iron.) a. Why is aluminium with a steel core used for...
-
Use the data to construct a 95% confidence interval estimate of the number of credit hours taken by the population of full-time students. Write a brief statement that interprets the result. The...
-
Use the data to find the statistical measures. a. What is the range? b. What is the mean? c. What is the median? d. What is the mode? 42 86 92 15 32 67 48 19 87 63 15 19 21 17 53 27 21 15 82 15
-
You would like to design a product to sell to shopping malls that tells them more about the behaviours of their customers. The system would use cameras to track customers as they walk from store to...
-
What are some reasons for differences between the amounts of incurred and applied overhead?
-
A thin infinitely long thread carrying a charge , per unit length is oriented parallel to the infinite conducting plane. The distance between the thread and the plane is equal to l. Find: (a) The...
-
Consider the following cash flow profile and assume MARR is 10 percent/year and the finance rate is 4 percent/year. a. Determine the MIRR for this project. b. Is this project economically attractive?...
-
Beacon Company maintains and repairs warnings lights, such as those found on radio towers and lighthouses. Beacon Company prepared the end-of-period spreadsheet shown on the next page at October 31,...
-
What output will be produced by the following code segment? int divide (double a, double b}{ } return (a/b); int main(){ double x=1.0, y = 4.0; cout < < divide(x, y); return 0; }
-
Howies Bakery is one of the most popular bakeries in town, and the favorite at Howies is French bread. Each day of the week, Howies bakes a number of loaves of French bread, more or less according to...
-
Company A Company B Number of Units sold 2,400 Total Per unit total Per unit Sales 485,100 99.00 Variable costs 313,600 129,600 Contribution Margin 175,200 Fixed Costs 64,800 Income 112,700 How to...
-
What do we know about a good when it has a perfectly inelastic supply?
-
We will always find worthy causes that need funds. Does that mean we should pull back funds on worthy causes? Can we get funds by reducing fraud, lowering politicians paychecks, perhaps trimming some...
-
In the 1930s, communism and socialism were on the rise, partially in response to the grinding poverty, joblessness, and despair. The Communists claimed that "communism is the new Americanism."...
-
Why should we trade? What is the gain from trade? Is carry trade any different? Is outsourcing a good idea for a company and the economy?
-
Did COVID-19 reveal the objective reality of the class system in Canada? o The Upper or ownership Class has wealth sufficient to make them independent of broader economic forces o The Middle class...
-
ABC Co. uses the installment sales method. On January 1, 20x1,ABC Co. sold goods costing P780,717 for an installment sale price of P2,200,000 collectible as follows: 20% down payment Balance is...
-
Suppose you are comparing just two means. Among the possible statistics you could use is the difference in means, the MAD, or the max min (the difference between the largest mean and the smallest...
-
To investigate the growth of the canine population in New York City, 100 dogs are randomly selected from a registry of licensed pets in the city, and it is found that 78 of them have been neutered....
-
The 2010 US Census reports that, of all the nations occupied housing units, 65.1% are owned by the occupants and 34.9% are rented. If we take random samples of 50 occupied housing units and compute...
-
Table C.1 shows a two-way table for Servers A, B, and C and for whether a credit/debit card or cash was used for payment (yes for a credit or debit card, no for cash). Do the data in the table...
-
Wakuluk is most likely to make significant adjustments to her estimate of the future growth trend for which of the following countries? A. Country Y only B. Country Z only C. Countries Y and Z Neshie...
-
Wakuluks approach to economic forecasting: A. is flexible and limited in complexity. B. can give a false sense of precision and provide false signals. C. imposes no consistency of analysis across...
-
Wakuluk most likely seeks to mitigate which of the following biases in developing capital market forecasts? A. Availability B. Time period C. Survivorship Neshie Wakuluk is an investment strategist...
Study smarter with the SolutionInn App