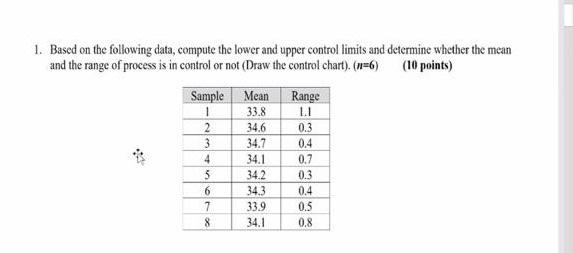
Question: Mean 1. Based on the following data, compute the lower and upper control limits and determine whether the mean and the range of process is

Mean 1. Based on the following data, compute the
Mean 1. Based on the following data, compute the lower and upper control limits and determine whether the mean and the range of process is in control or not (Draw the control chart). (n=6) (10 points) Sample Range 33.8 LI 2 34.6 34.7 0.4 34.1 0.7 1 0.3 3 4 5 6 7 8 34.2 34.3 33.9 34.1 0.3 0.4 0.5 0.8

Step by Step Solution

There are 3 Steps involved in it

1 Expert Approved Answer
Step: 1 Unlock blur-text-image
Question Has Been Solved by an Expert!

Get step-by-step solutions from verified subject matter experts

Step: 2 Unlock
Step: 3 Unlock

Students Have Also Explored These Related General Management Questions!