

Question: Mean = Frequency 0 2) Here are data on SAT scores. Given this graph, what is a reasonable guess for the mean and standard
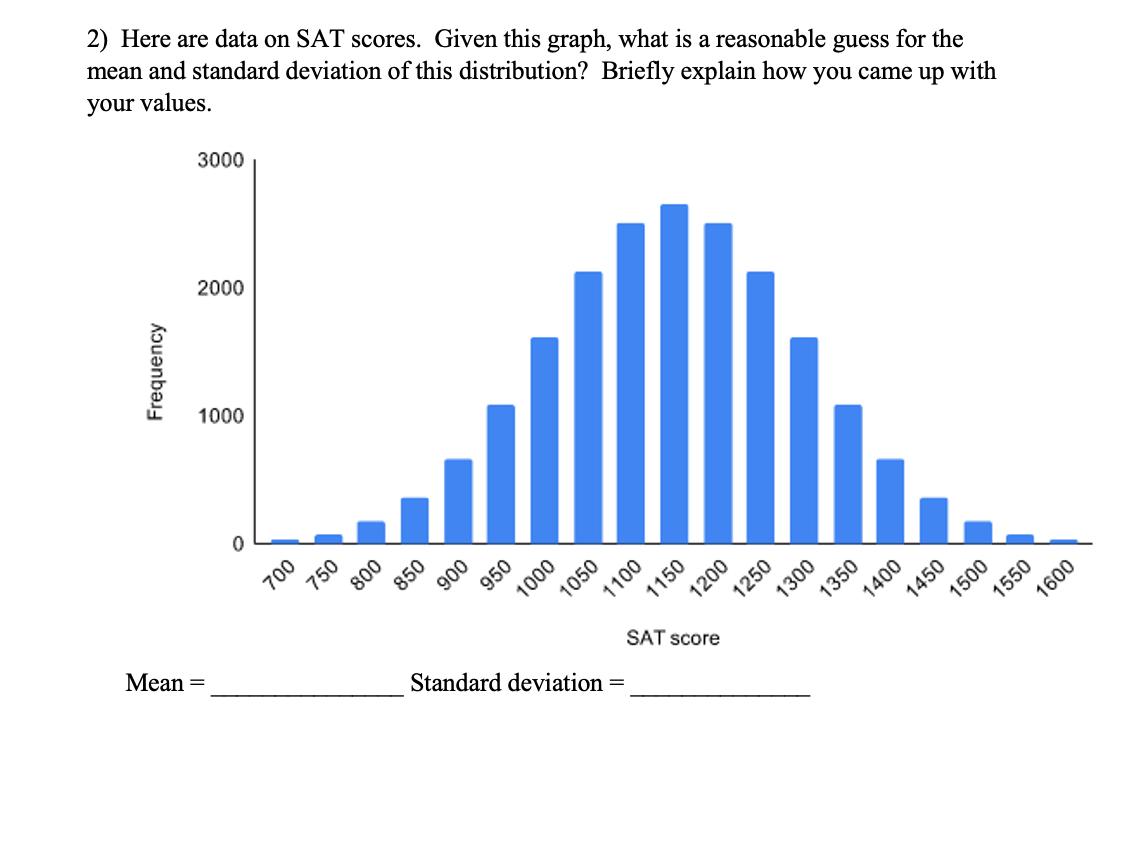
Mean = Frequency 0 2) Here are data on SAT scores. Given this graph, what is a reasonable guess for the mean and standard deviation of this distribution? Briefly explain how you came up with your values. 3000 1000 2000 700 750 800 850 900 950 1000 1050 1100 SAT score 1150 1200 Standard deviation = 1250 1300 1350 1400 1450 1500 1550 1600
Step by Step Solution
There are 3 Steps involved in it
1 Expert Approved Answer
Step: 1 Unlock

Question Has Been Solved by an Expert!
Get step-by-step solutions from verified subject matter experts
Step: 2 Unlock
Step: 3 Unlock