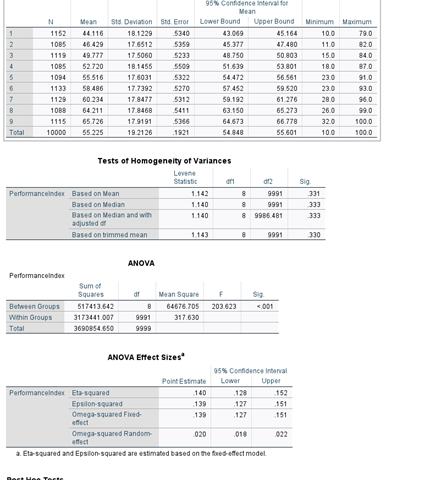
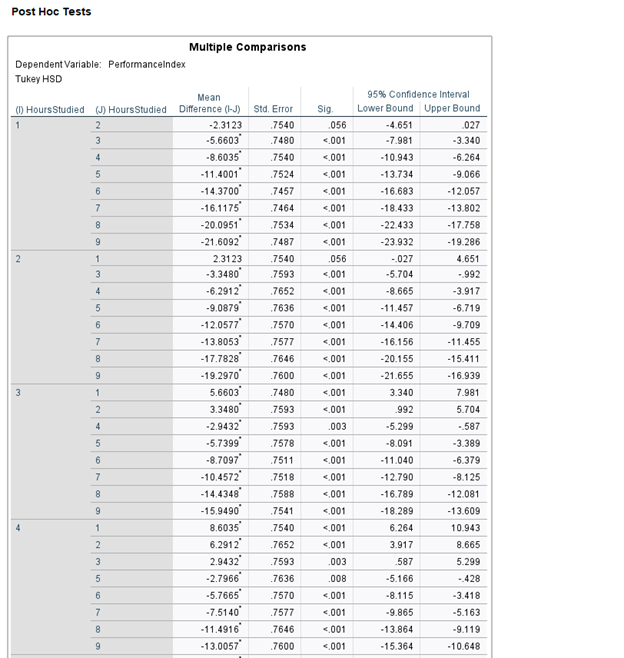
Question: Mean N Mean Sid Deviation Sod, Error Lower Bound Upper Bound Minimum Ledmum 1152 14116 18.1229 5340 43.069 5164 10 0 1085 46 429 17
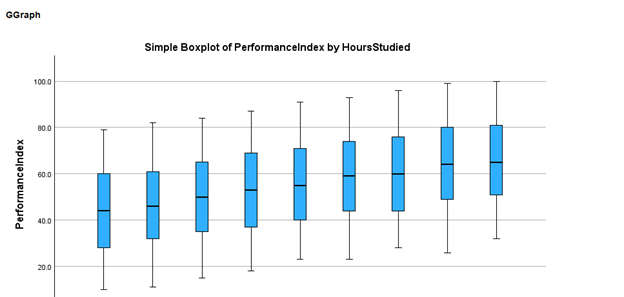
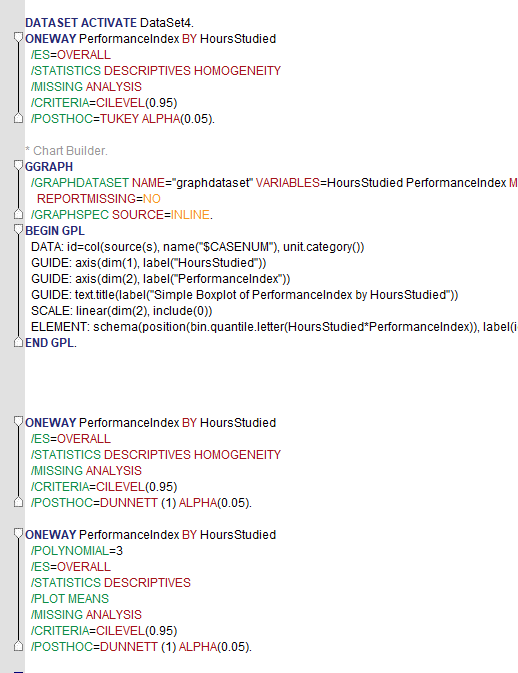
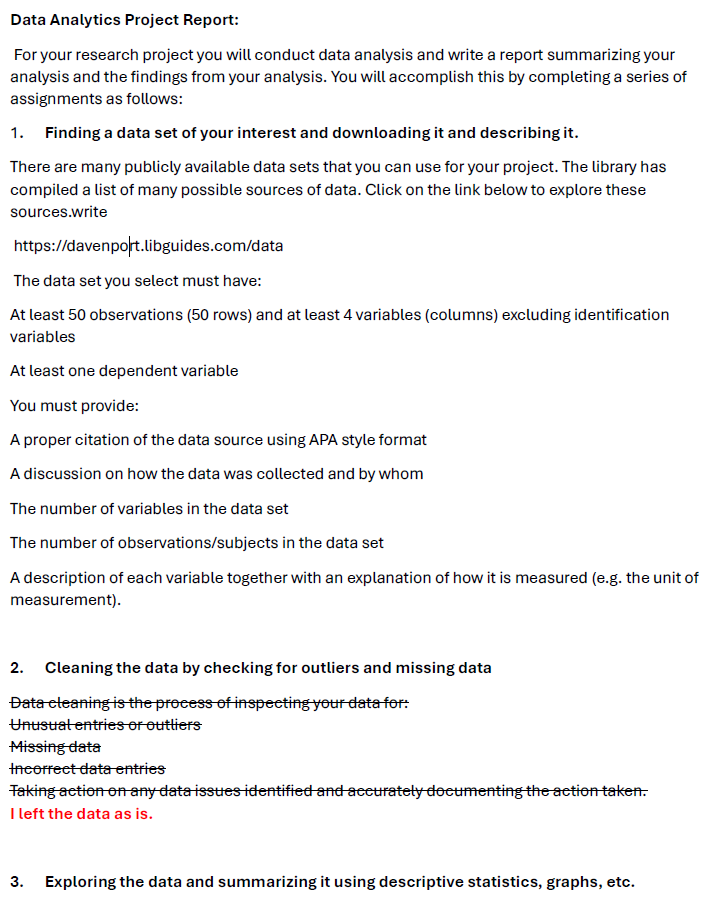
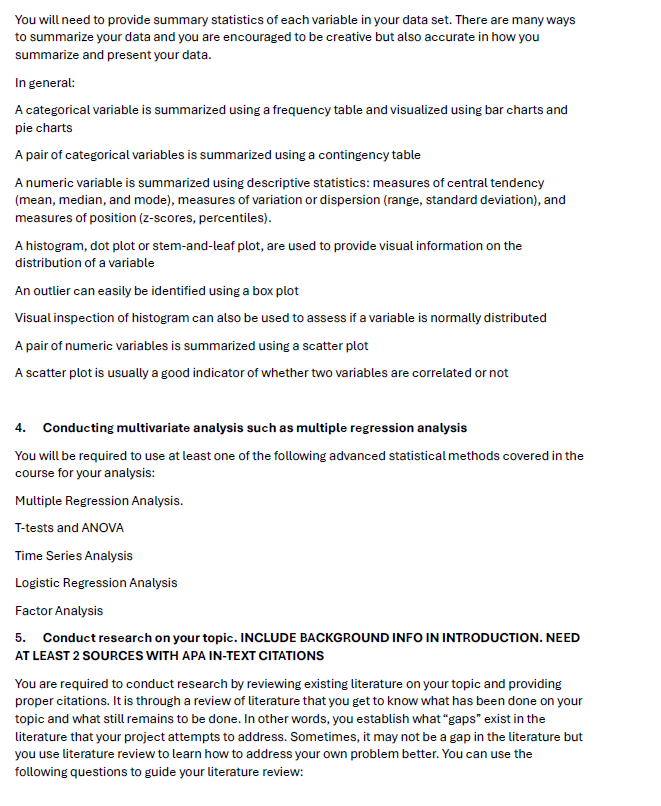
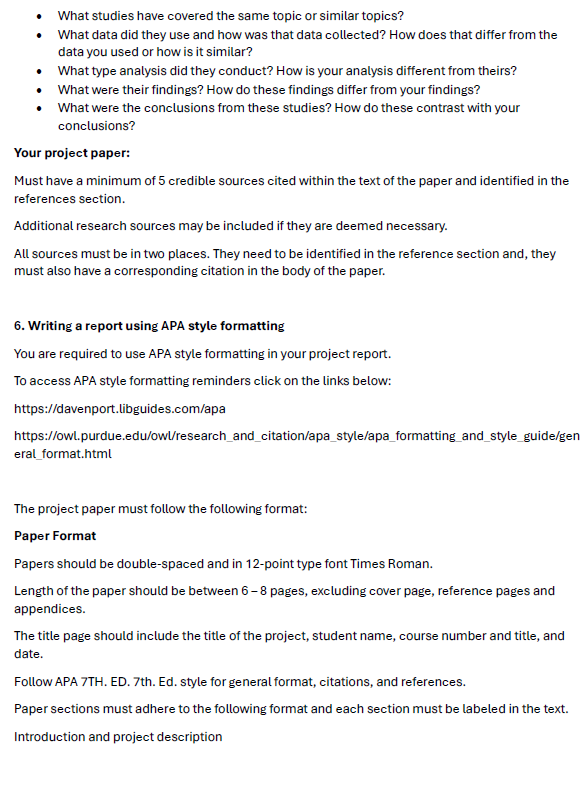
Mean N Mean Sid Deviation Sod, Error Lower Bound Upper Bound Minimum Ledmum 1152 14116 18.1229 5340 43.069 5164 10 0 1085 46 429 17 6512 5159 45.377 47 480 110 1119 19 777 17 5060 5233 48.750 50 803 150 84.0 1085 52 720 18.1455 5400 51 439 53 801 180 $7.0 1094 55 516 17 5031 54.472 56 561 23.0 1133 58 486 17 7392 $270 57 452 59 520 23.0 $3.0 1129 60 234 .5312 59.192 61 276 28.0 108B 64 211 17 8468 63.150 65 273 26.0 1115 65 726 17 9191 5346 641673 66 778 320 100.0 10000 55 225 19 2126 .1921 54.848 55 601 10.0 100.0 Tests of Homogeneity of Variances Statistic Performanceindex Based on Mean 1-142 9991 331 Based on Median 1-140 2991 333 Based on Median and with 1-140 9985.481 333 adjusted Based on trimmed maan 1.143 330 ANOVA Performanceindex Sum of Squares Mean Square Butwe in Groups 517413.642 203 623 Within Groups 31 73441.007 9891 317.630 Total 3690854.650 9995 ANOVA Effect Sizes" 95% Confidence Interval Point Estimate Lower Uppu Performanceindex Eta-squared 140 152 Eppilon-squared 130 137 151 Omega-squared Fbed 139 137 151 Omega-squared Random 020 422 a. Ela squared and Epsilon squared are estimated based on the thes affect model\fGGraph Simple Boxplot of Performanceindex by HoursStudied 100.0 6010 Performanceindex 4010 2010DATASET ACTIVATE DataSet4. "ONEWAY PerformanceIndex BY HoursStudied /ES=OVERALL /STATISTICS DESCRIPTIVES HOMOGENEITY /MISSING ANALYSIS /CRITERIA=CILEVEL(0.95) /POSTHOC=TUKEY ALPHA(0.05). * Chart Builder. GGRAPH /GRAPHDATASET NAME="graphdataset" VARIABLES=HoursStudied PerformanceIndex M REPORTMISSING=NO /GRAPHSPEC SOURCE=INLINE. BEGIN GPL DATA: id=col(source(s), name("$CASENUM"), unit.category()) GUIDE: axis (dim(1), label("HoursStudied")) GUIDE: axis (dim(2), label("PerformanceIndex")) GUIDE: text.title(label("Simple Boxplot of PerformanceIndex by HoursStudied")) SCALE: linear(dim(2), include(0)) ELEMENT: schema(position(bin. quantile.letter(HoursStudied*PerformanceIndex)), label( END GPL. ONEWAY PerformanceIndex BY HoursStudied YES=OVERALL /STATISTICS DESCRIPTIVES HOMOGENEITY /MISSING ANALYSIS /CRITERIA=CILEVEL(0.95) /POSTHOC=DUNNETT (1) ALPHA(0.05). ONEWAY PerformanceIndex BY HoursStudied POLYNOMIAL=3 /ES=OVERALL /STATISTICS DESCRIPTIVES /PLOT MEANS (MISSING ANALYSIS /CRITERIA=CILEVEL(0.95) /POSTHOC=DUNNETT (1) ALPHA(0.05).\fData Analytics Project Report: For your research project you will conduct data analysis and write a report summarizing your analysis and the findings from your analysis. You will accomplish this by completing a series of assignments as follows: 1. Finding a data set of your interest and downloading it and describing it. There are many publicly available data sets that you can use for your project. The library has compiled a list of many possible sources of data. Click on the link below to explore these sources.write https://davenpolt.libguides.com/data The data set you select must have: At least 50 observations (50 rows) and at least 4 variables (columns) excluding identification variables At least one dependent variable You must provide: A proper citation of the data source using APA style format Adiscussion on how the data was collected and by whom The number of variables in the data set The number of observations/subjects in the data set A description of each variable together with an explanation of how it is measured (e.g. the unit of measurement). 2. Cleaning the data by checking for outliers and missing data | left the data as is. 3. Exploring the data and summarizing it using descriptive statistics, graphs, etc. You will need to provide summary statistics of each variable in your data set. There are many ways to summarize your data and you are encouraged to be creative but also accurate in how you summarize and present your data. In general: A categorical variable is summarized using a freguency table and visualized using bar charts and pie charts A pair of categorical variables is summarized using a contingency table A numeric variable is summarized using descriptive statistics: measures of central tendency [mean, median, and mode), measures of variation or dispersion (range, standard deviation), and measures of position (z-scores, percentiles). A histogram, dot plot or stem-and-leaf plot, are used to provide visual information on the distribution of a variable An outlier can easily be identified using a box plot Visualinspection of histogram can also be used to assess if a variable is normally distributed A pair of numeric variables is summarized using a scatter plot A scatter plot is usually a good indicator of whether two variables are correlated or not 4. Conducting multivariate analysis such as multiple regression analysis You will be reqguired to use at least one of the following advanced statistical methods covered in the course for your analysis: Multiple Regression Analysis. T-tests and ANOVA Time Series Analysis Logistic Regression Analysis Factor Analysis 5. Conductresearch onyour topic. INCLUDE BACKGROUND INFO IN INTRODUCTION. NEED AT LEAST 2 SOURCES WITH APA IN-TEXT CITATIONS You are required to conduct research by reviewing existing literature on your topic and providing proper citations. It is through a review of literature that you get to know what has been done on your topic and what still remains to be done. In other words, you establish what \"gaps\" existin the literature that your project attempts to address. Sometimes, it may not be a gap in the literature but wou use literature review to learn how to address your own problem better. You can use the following guestions to guide your literature review: What studies have covered the same tapic or similar topics? + What data did they use and how was that data collected? How does that differ from the data you used ar how is it similar? 'What type analysis did they conduct? How is your analysis different from theirs? What were their findings? How do these findings differ from your findings? + What were the conclusions from these studi=s? How do these contrast with your conclusions? Your project paper: Must have a minimum of 5 credible sources cited within the text of the paper and identified in the references section. Additional research sources may be included if they are deemed necessary. All sources must be in two places. They need to be identified in the reference section and, they must also have a corresponding citation in the body of the paper. 6. Writing a report using APA style formatting You are required to use APA style formatting in your project report. To access APA style formatting reminders click on the links below: https://davenport.libguides.com/fapa https:/fowl purdue.edu/owlresearch_and citationfapa_stylefapa formatting and_style guide/gen eral_format.html The project paper must follow the following format: Paper Format Papers should be double-spaced and in 12-point type font Times Roman. Length of the paper should be between G- 8 pages, excluding cover page, reference pages and appendices. The title page should include the title of the project, student name, course number and title, and date. Follow APA 7TH. ED. 7th. Ed. style for gensral format, citations, and references. Paper sections must adhere to the following format and each section must be labeled in the text. Introduction and project description Literature Review Data sources, data cleaning and description Descriptive statistics and Data Visualization MEAN, STD DEV, ETC, GRAPHS Analytical Model and Data Analysis FOCUS ON DATA ANALYSIS Results (what did you find in non-statistical wording) Conclusion (what are you going to do with the results) References Appendix Language should be clear, concise, and precise. Tone should be professional, consistent, and not filled with jargan. Grammar and syntax (sentence structure) must be correct. Paper must be free of misspellings and typos. Tables and Figures All figures and tables must be referred to in the text before they appear on the page. Figures and tables should appear on the same page or the next page as the text that refers to them. All figures and tables need titles. Titles go below figures and above tables. Quotations and Citations Quotations and citations are crucial components of a research paper. However, overuse of guotations denies you the opportunity to express yourself. While there is no hard rule on guotations, | recommend keeping them at 7% or less of the entire text. Failure to properly cite research sources and borrowed ideas is plagiarism. Papers submitted without appropriate citations and references will be returned to the student with no grade. Refer to APA 7TH. ED. 7th. Ed. style guide for assistance with properly citing quoted and/for paraphrased materials and formatting references. To get these instructions as a word document click the following link: Data 275 Data Analytics Project Assignment
Step by Step Solution
There are 3 Steps involved in it
1 Expert Approved Answer
Step: 1 Unlock
Question Has Been Solved by an Expert!
Get step-by-step solutions from verified subject matter experts
Step: 2 Unlock
Step: 3 Unlock
Students Have Also Explored These Related Business Writing Questions!