

Question: Mean return You should get a graph that looks something like the following: 20% Efficient Frontier Showing the Individual Stocks 18% 16% 14% 12%
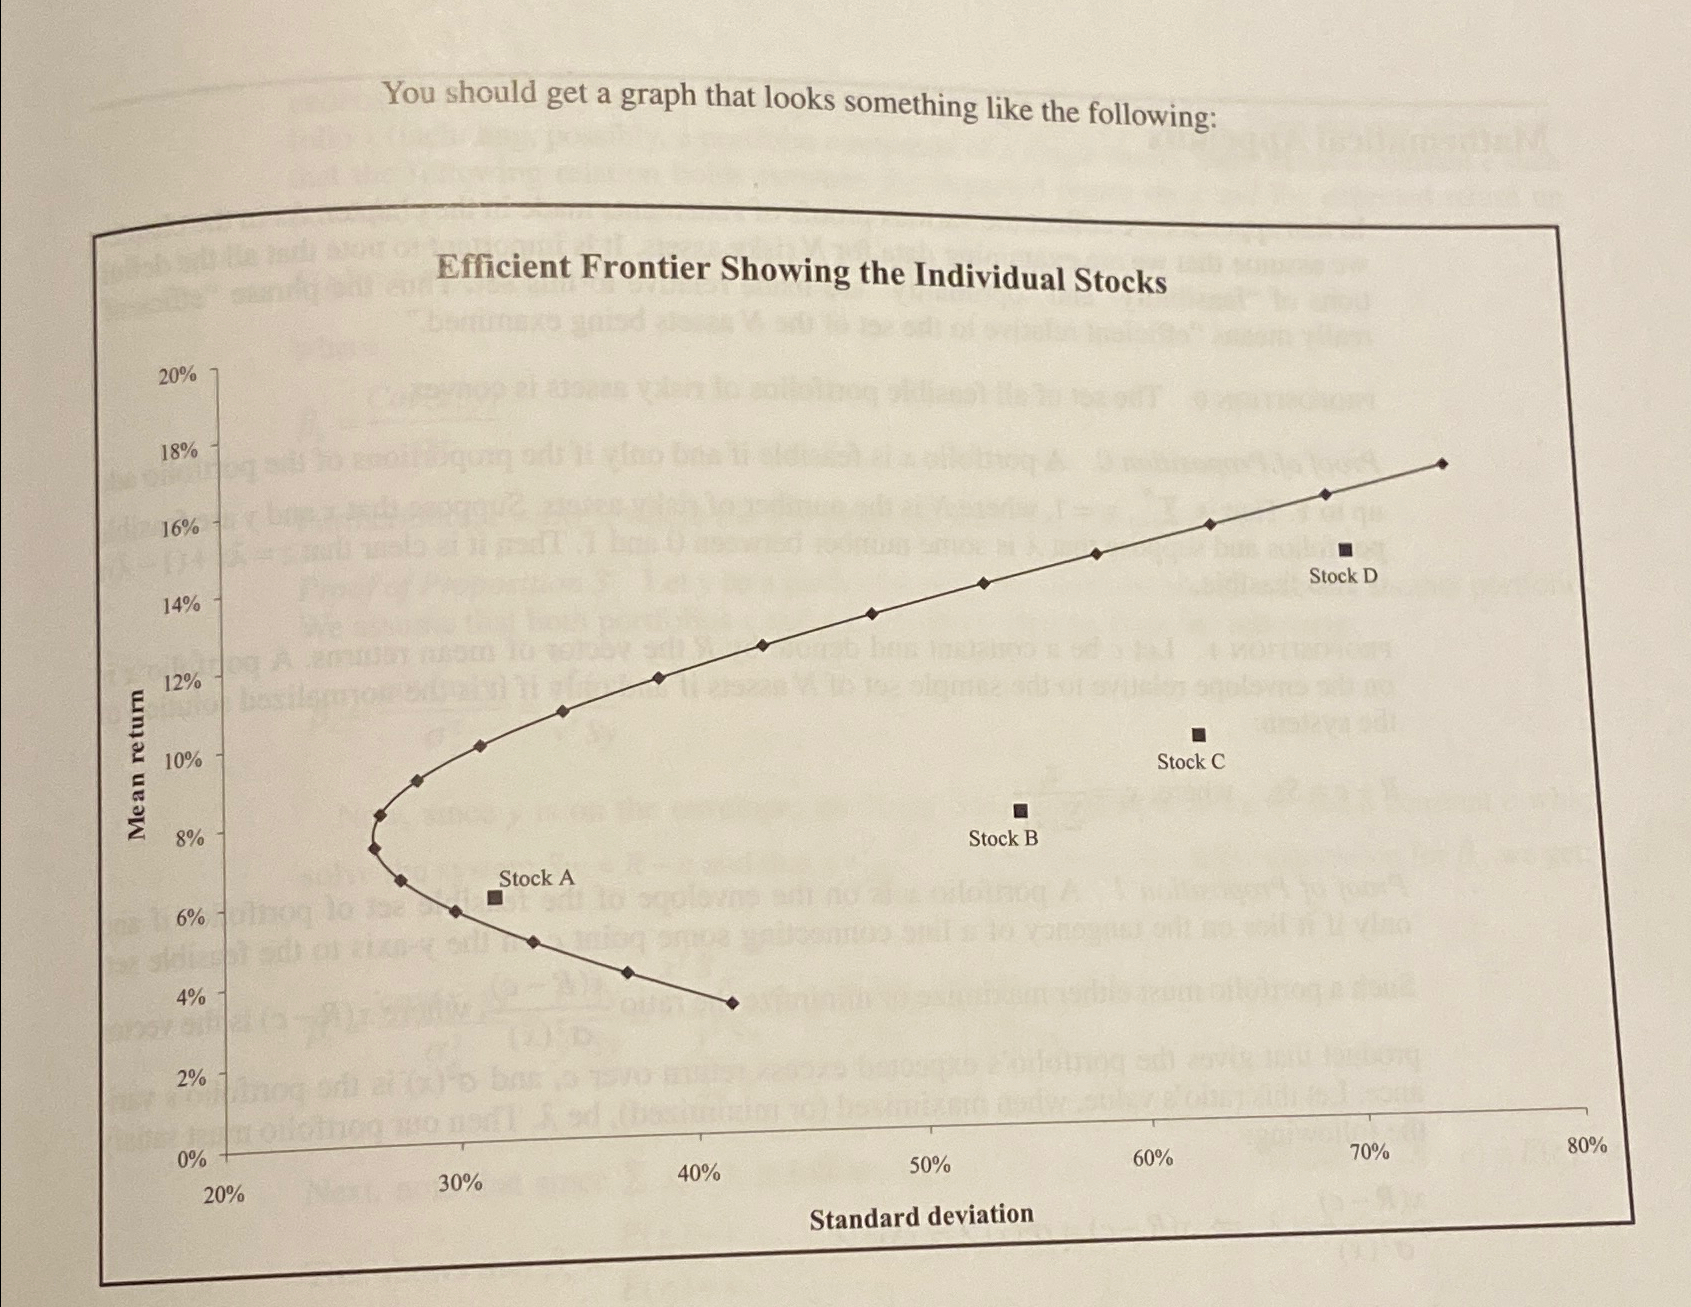
Mean return You should get a graph that looks something like the following: 20% Efficient Frontier Showing the Individual Stocks 18% 16% 14% 12% 10% 8% Stock B Stock A 6% 4% 26 Stock C Stock D 0% 20% Next 30% 40% 50% 60% 70% 80% Standard deviation
Step by Step Solution
There are 3 Steps involved in it
1 Expert Approved Answer
Step: 1 Unlock

Question Has Been Solved by an Expert!
Get step-by-step solutions from verified subject matter experts
Step: 2 Unlock
Step: 3 Unlock