

Question: Measurement Error and Graphing @ 25pts Introduction: This preliminary exercise (Individualized, No Lab Partners) is designed to introduce error in measurements and why we graph

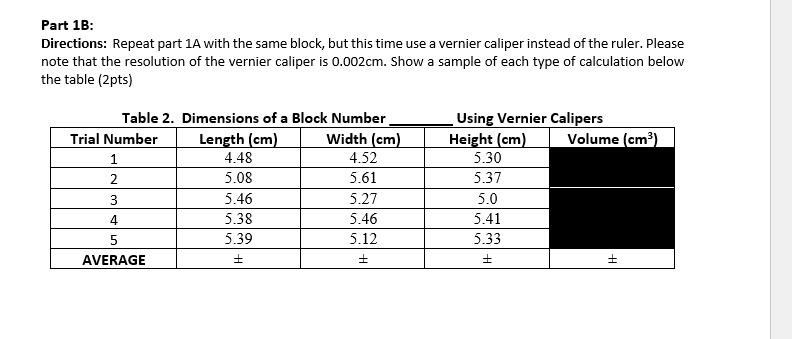
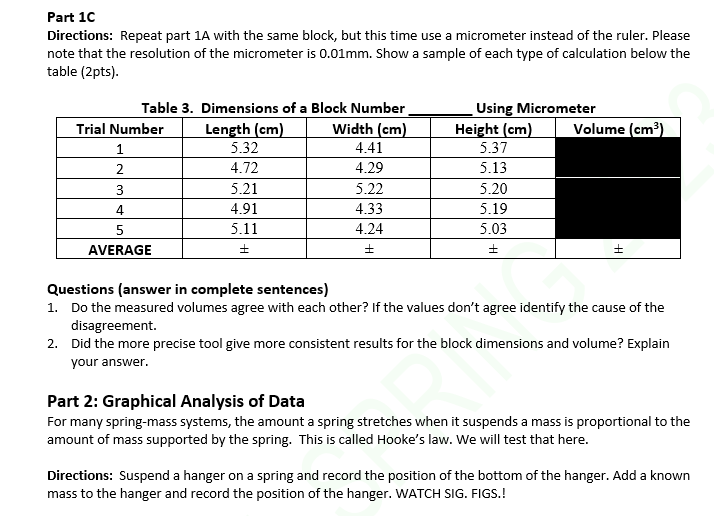
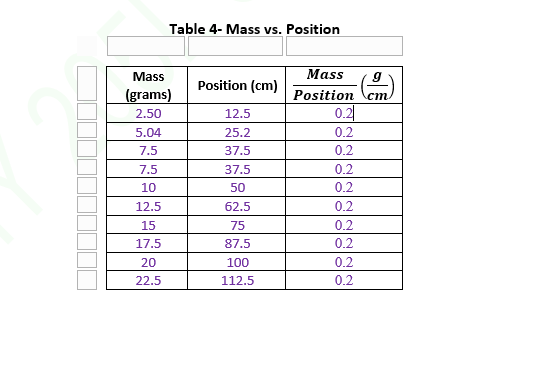
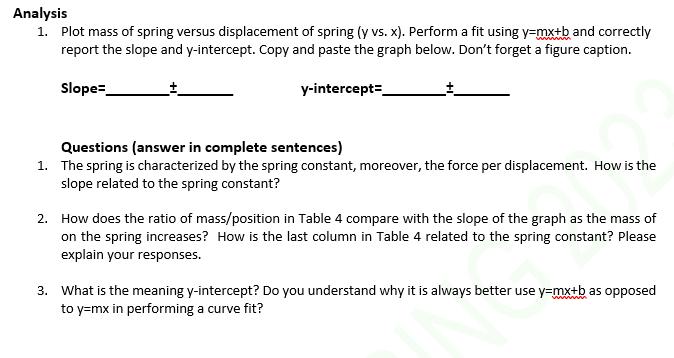
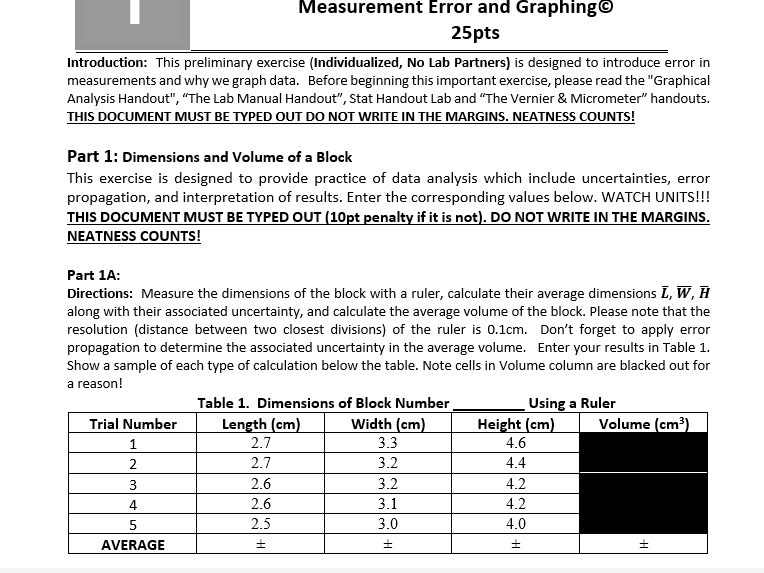


Measurement Error and Graphing @ 25pts Introduction: This preliminary exercise (Individualized, No Lab Partners) is designed to introduce error in measurements and why we graph data. Before beginning this important exercise, please read the "Graphical Analysis Handout", "The Lab Manual Handout", Stat Handout Lab and "The Vernier & Micrometer" handouts. THIS DOCUMENT MUST BE TYPED OUT DO NOT WRITE IN THE MARGINS. NEATNESS COUNTS! Part 1: Dimensions and Volume of a Block This exercise is designed to provide practice of data analysis which include uncertainties, error propagation, and interpretation of results. Enter the corresponding values below. WATCH UNITS!!! THIS DOCUMENT MUST BE TYPED OUT (10pt penalty if it is not). DO NOT WRITE IN THE MARGINS. NEATNESS COUNTS! Part 1A: Directions: Measure the dimensions of the block with a ruler, calculate their average dimensions L, W, H along with their associated uncertainty, and calculate the average volume of the block. Please note that the resolution (distance between two closest divisions) of the ruler is 0.1cm. Don't forget to apply error propagation to determine the associated uncertainty in the average volume. Enter your results in Table 1. Show a sample of each type of calculation below the table. Note cells in Volume column are blacked out for a reason! Table 1. Dimensions of Block Number Using a Ruler Trial Number Length (cm) Width (cm) Height (cm) Volume (cm3) 1 2.7 3.3 4.6 2 2.7 3.2 4.4 3 2.6 3.2 4.2 4 2.6 3.1 4.2 5 2.5 3.0 4.0 AVERAGEPart 1B: Directions: Repeat part 1A with the same block, but this time use a vernier caliper instead of the ruler. Please note that the resolution of the vernier caliper is 0.002cm. Show a sample of each type of calculation below the table (2pts) Table 2. Dimensions of a Block Number Using Vernier Calipers Trial Number Length (cm) Width (cm) Height (cm) Volume (cm3) 1 4.48 4.52 5.30 2 5.08 5.61 5.37 3 5.46 5.27 5.0 4 5.38 5.46 5.41 5 5.39 5.12 5.33 AVERAGEPart 1C Directions: Repeat part 1A with the same block, but this time use a micrometer instead of the ruler. Please note that the resolution of the micrometer is 0.01mm. Show a sample of each type of calculation below the table (2pts). Table 3. Dimensions of a Block Number Using Micrometer Trial Number Length (cm) Width (cm) Height (cm) Volume (cm3) 1 5.32 4.41 5.37 2 4.72 4.29 5.13 3 5.21 5.22 5.20 4 4.91 4.33 5.19 5 5.11 4.24 5.03 AVERAGE F Questions (answer in complete sentences) 1. Do the measured volumes agree with each other? If the values don't agree identify the cause of the disagreement. 2. Did the more precise tool give more consistent results for the block dimensions and volume? Explain your answer. Part 2: Graphical Analysis of Data For many spring-mass systems, the amount a spring stretches when it suspends a mass is proportional to the amount of mass supported by the spring. This is called Hooke's law. We will test that here. Directions: Suspend a hanger on a spring and record the position of the bottom of the hanger. Add a known mass to the hanger and record the position of the hanger. WATCH SIG. FIGS.!Table 4- Mass vs. Position Mass Mass (grams) Position (cm) Position cmn 2.50 12.5 0.2 5.04 25.2 0.2 7.5 37.5 0.2 7.5 37.5 0.2 10 50 0.2 12.5 62.5 0.2 15 75 0.2 17.5 87.5 0.2 20 100 0.2 22.5 112.5 0.2Analysis 1. Plot mass of spring yersus displacement of spring (y ys. 1:]. Perform a fit using Fm and correctly report the slope and y-intercept. Copy and paste the graph below. Don't forget a gure caption. Slope: i y-interce pt: 1 Questions [answer in complete sentences} 1. The spring is characterized by the spring constant, moreover, the force per displacement. How is the slope related to the spring constant? 2. How does the ratio of massfposition in Table 4 compare with the slope of the graph as the mass of on the spring increases? How is the last column in Table 4 related to the spring constant? Please explain your responses. 3. What is the meaning y-intercept? Do you understand why it is always better use PM as opposed to y=rnx in performing a curve t
Step by Step Solution
There are 3 Steps involved in it

Get step-by-step solutions from verified subject matter experts