

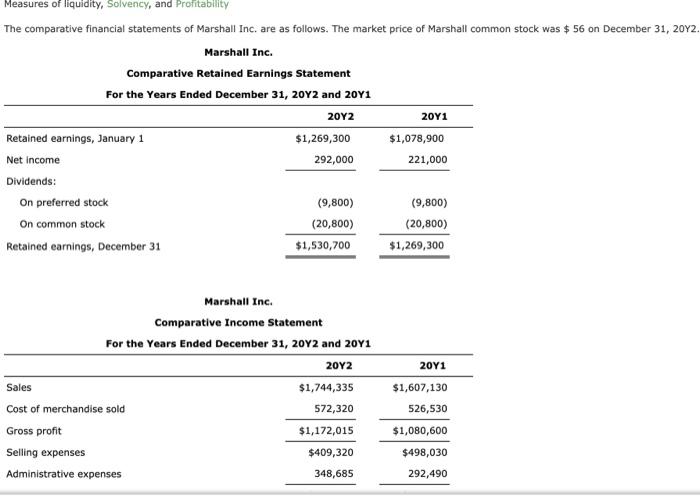
Measures of liquidity, Solvency, and Profitability The comparative financial statements of Marshall Inc. are as follows....
Fantastic news! We've Found the answer you've been seeking!
Question:
Transcribed Image Text:
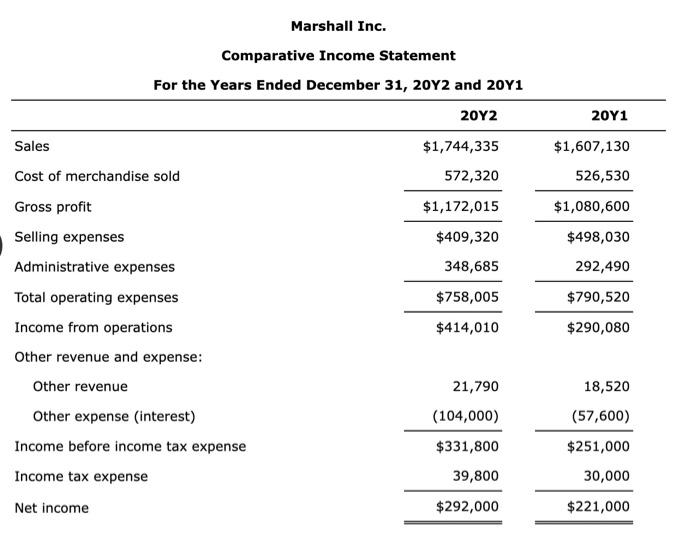
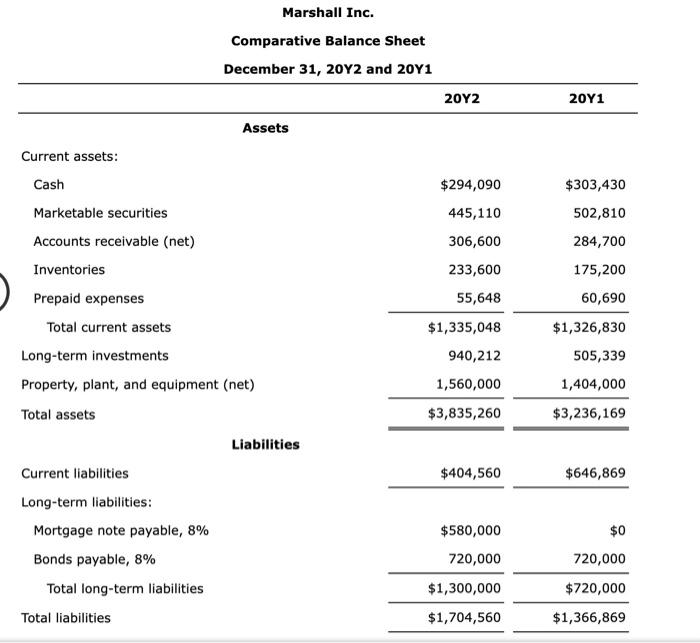
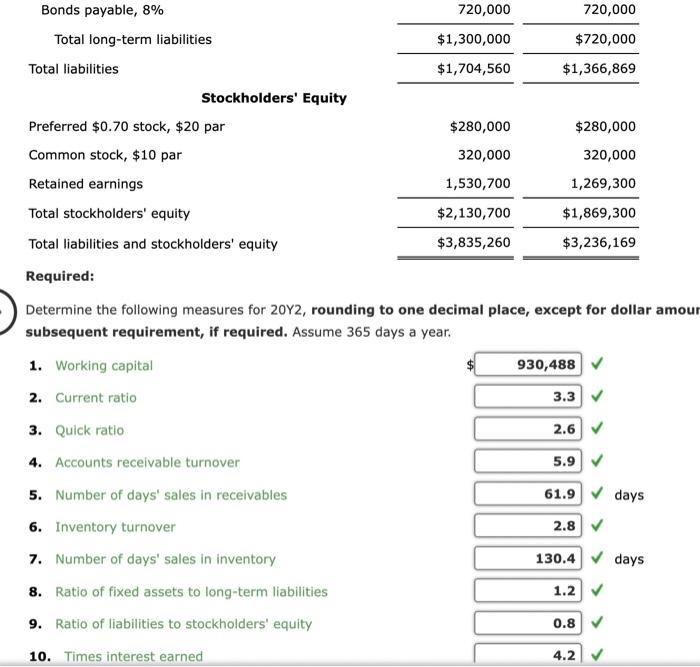
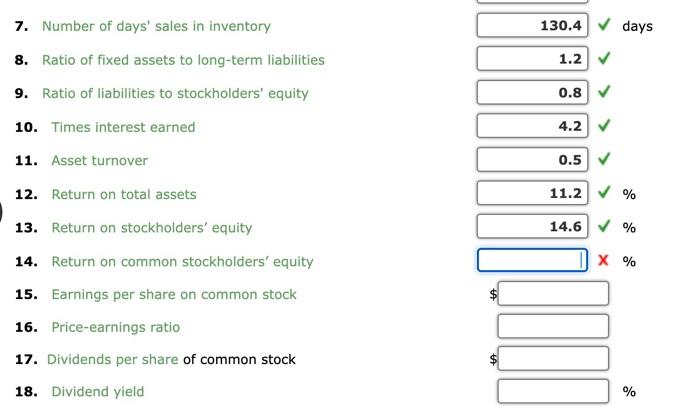
Measures of liquidity, Solvency, and Profitability The comparative financial statements of Marshall Inc. are as follows. The market price of Marshall common stock was $ 56 on December 31, 2012. Marshall Inc. Comparative Retained Earnings Statement For the Years Ended December 31, 2012 and 20Y1 20Y2 20Y1 Retained earnings, January 1 $1,269,300 $1,078,900 Net income 292,000 221,000 Dividends: On preferred stock On common stock Retained earnings, December 31 Sales (9,800) (9,800) (20,800) $1,530,700 (20,800) $1,269,300 Marshall Inc. Comparative Income Statement For the Years Ended December 31, 2012 and 20Y1 Cost of merchandise sold Gross profit Selling expenses Administrative expenses 2012 20Y1 $1,744,335 $1,607,130 572,320 526,530 $1,172,015 $1,080,600 $409,320 $498,030 348,685 292,490 Marshall Inc. Comparative Income Statement For the Years Ended December 31, 20Y2 and 20Y1 Sales Cost of merchandise sold Gross profit Selling expenses Administrative expenses Total operating expenses. Income from operations 20Y2 20Y1 $1,744,335 $1,607,130 572,320 526,530 $1,172,015 $1,080,600 $409,320 $498,030 348,685 292,490 $758,005 $790,520 $414,010 $290,080 Other revenue and expense: Other revenue 21,790 18,520 Other expense (interest) (104,000) (57,600) Income before income tax expense $331,800 $251,000 Income tax expense 39,800 30,000 Net income $292,000 $221,000 Current assets: Cash Marketable securities Accounts receivable (net) Inventories Prepaid expenses Total current assets Long-term investments Marshall Inc. Comparative Balance Sheet December 31, 20Y2 and 20Y1 Assets 20Y2 20Y1 $294,090 $303,430 445,110 502,810 306,600 284,700 233,600 175,200 55,648 60,690 $1,335,048 $1,326,830 940,212 505,339 1,560,000 1,404,000 $3,835,260 $3,236,169 Liabilities $404,560 $646,869 Property, plant, and equipment (net) Total assets Current liabilities Long-term liabilities: Mortgage note payable, 8% Bonds payable, 8% Total long-term liabilities Total liabilities $580,000 $0 720,000 720,000 $1,300,000 $720,000 $1,704,560 $1,366,869 Bonds payable, 8% Total long-term liabilities Total liabilities 720,000 720,000 $1,300,000 $720,000 $1,704,560 $1,366,869 Stockholders' Equity Preferred $0.70 stock, $20 par $280,000 $280,000 Common stock, $10 par 320,000 320,000 Retained earnings 1,530,700 1,269,300 Total stockholders' equity $2,130,700 $1,869,300 Total liabilities and stockholders' equity $3,835,260 $3,236,169 Required: Determine the following measures for 2012, rounding to one decimal place, except for dollar amour subsequent requirement, if required. Assume 365 days a year. 1. Working capital 2. Current ratio 3. Quick ratio 4. Accounts receivable turnover 5. Number of days' sales in receivables 6. Inventory turnover 7. Number of days' sales in inventory 8. Ratio of fixed assets to long-term liabilities 9. Ratio of liabilities to stockholders' equity 10. Times interest earned 930,488 3.3 2.6 5.9 61.9 days 2.8 130.4 days 1.2 0.8 4.2 V 7. Number of days' sales in inventory 8. Ratio of fixed assets to long-term liabilities 9. Ratio of liabilities to stockholders' equity 130.4 10. Times interest earned 11. Asset turnover 12. Return on total assets 13. Return on stockholders' equity 14. Return on common stockholders' equity 15. Earnings per share on common stock 16. Price-earnings ratio 17. Dividends per share of common stock 18. Dividend yield days 1.2 0.8 4.2 0.5 11.2 % 14.6 % X % % Measures of liquidity, Solvency, and Profitability The comparative financial statements of Marshall Inc. are as follows. The market price of Marshall common stock was $ 56 on December 31, 2012. Marshall Inc. Comparative Retained Earnings Statement For the Years Ended December 31, 2012 and 20Y1 20Y2 20Y1 Retained earnings, January 1 $1,269,300 $1,078,900 Net income 292,000 221,000 Dividends: On preferred stock On common stock Retained earnings, December 31 Sales (9,800) (9,800) (20,800) $1,530,700 (20,800) $1,269,300 Marshall Inc. Comparative Income Statement For the Years Ended December 31, 2012 and 20Y1 Cost of merchandise sold Gross profit Selling expenses Administrative expenses 2012 20Y1 $1,744,335 $1,607,130 572,320 526,530 $1,172,015 $1,080,600 $409,320 $498,030 348,685 292,490 Marshall Inc. Comparative Income Statement For the Years Ended December 31, 20Y2 and 20Y1 Sales Cost of merchandise sold Gross profit Selling expenses Administrative expenses Total operating expenses. Income from operations 20Y2 20Y1 $1,744,335 $1,607,130 572,320 526,530 $1,172,015 $1,080,600 $409,320 $498,030 348,685 292,490 $758,005 $790,520 $414,010 $290,080 Other revenue and expense: Other revenue 21,790 18,520 Other expense (interest) (104,000) (57,600) Income before income tax expense $331,800 $251,000 Income tax expense 39,800 30,000 Net income $292,000 $221,000 Current assets: Cash Marketable securities Accounts receivable (net) Inventories Prepaid expenses Total current assets Long-term investments Marshall Inc. Comparative Balance Sheet December 31, 20Y2 and 20Y1 Assets 20Y2 20Y1 $294,090 $303,430 445,110 502,810 306,600 284,700 233,600 175,200 55,648 60,690 $1,335,048 $1,326,830 940,212 505,339 1,560,000 1,404,000 $3,835,260 $3,236,169 Liabilities $404,560 $646,869 Property, plant, and equipment (net) Total assets Current liabilities Long-term liabilities: Mortgage note payable, 8% Bonds payable, 8% Total long-term liabilities Total liabilities $580,000 $0 720,000 720,000 $1,300,000 $720,000 $1,704,560 $1,366,869 Bonds payable, 8% Total long-term liabilities Total liabilities 720,000 720,000 $1,300,000 $720,000 $1,704,560 $1,366,869 Stockholders' Equity Preferred $0.70 stock, $20 par $280,000 $280,000 Common stock, $10 par 320,000 320,000 Retained earnings 1,530,700 1,269,300 Total stockholders' equity $2,130,700 $1,869,300 Total liabilities and stockholders' equity $3,835,260 $3,236,169 Required: Determine the following measures for 2012, rounding to one decimal place, except for dollar amour subsequent requirement, if required. Assume 365 days a year. 1. Working capital 2. Current ratio 3. Quick ratio 4. Accounts receivable turnover 5. Number of days' sales in receivables 6. Inventory turnover 7. Number of days' sales in inventory 8. Ratio of fixed assets to long-term liabilities 9. Ratio of liabilities to stockholders' equity 10. Times interest earned 930,488 3.3 2.6 5.9 61.9 days 2.8 130.4 days 1.2 0.8 4.2 V 7. Number of days' sales in inventory 8. Ratio of fixed assets to long-term liabilities 9. Ratio of liabilities to stockholders' equity 130.4 10. Times interest earned 11. Asset turnover 12. Return on total assets 13. Return on stockholders' equity 14. Return on common stockholders' equity 15. Earnings per share on common stock 16. Price-earnings ratio 17. Dividends per share of common stock 18. Dividend yield days 1.2 0.8 4.2 0.5 11.2 % 14.6 % X % %
Expert Answer:

Related Book For 
Financial Accounting Tools for Business Decision Making
ISBN: 978-1118644942
6th Canadian edition
Authors: Paul D. Kimmel, Jerry J. Weygandt, Donald E. Kieso, Barbara Trenholm, Wayne Irvine
Posted Date:
Students also viewed these accounting questions
-
The comparative financial statements of Marshall Inc. are as follows. The market price of Marshall common stock was $82.60 on December 31, 20Y2. Question not attempted. Determine the following...
-
Nineteen Measures of Solvency and Profitability The comparative financial statements of Blige Inc. are as follows. The market price of Blige Inc. common stock was $62 on December 31, 2016. Blige Inc....
-
Most websites have images. There are many different features and functionalities that can be used to work with images via the use of JavaScript. These include preloading, rollovers, and cycling...
-
(a) Company A has been offered the rates shown in Table 7.3. It can borrow for three years at 6.45%. What floating rate can it swap this fixed rate into? (b) Company B has been offered the rates...
-
Derive the equation of the line through the points (α, a) and (β, b) in the Ït plane that are shown in Fig. 37. Then use it to find the linear function Ï(Ï)...
-
Define the gage factor of a strain gage.
-
Madson Corporations balance sheet at December 31, 2013, is presented below. During January 2014, the following transactions occurred. Madson uses the perpetual inventory method. Jan. 1 Madson...
-
Calculate the amount of owner's equity (in $) and the two leverage ratios for the given company. (Round ratios to the nearest hundredth.) Total Company Assets Total Liabilities Owner's Equity...
-
The capital accounts of Jamie Dexter and Max Gee have balances of $148,600 and $84,200, respectively. Darcey Lind and Loren Rothman are to be admitted to the partnership. Darcey Lind buys one-fifth...
-
5. Factor the following simple trinomials. a) p + 11p+30
-
8 0 miles per hour east . 9 0 miles per hour west. How long will it take to be 2 0 4 miles apart?
-
y = x4 dy dx
-
If 3x dx = 18 and b = 2a, then find the value of a to the hundredths place: ,
-
= Simplify the expression. 32 321-3 (Simplify your answer. Use positive exponents only. Use integers or fractions for any numbers in the expression.)
-
Is employer monitoring of employee social media justified?
-
A random sample of 10 houses heated with natural gas in a particular area, is selected, and the amount of gas (in therms) used during the month of January is determined for each house. The resulting...
-
Edward has the following income in 2023-24: He makes a total of 800 of Gift Aid donations during 2023-24. Compute the amount of income tax payable for the year.
-
Susan is granted a 20-year lease on a property, paying a premium of 76,000. Explain how tax relief will be given in relation to this premium if: (a) she uses the property for trading purposes, or (b)...
-
In 2023-24, Victor rents out a room in his home and receives rents of 8,150. He incurs allowable expenses of 820. What "rent-a-room" elections (if any) should he make?

Study smarter with the SolutionInn App