

Question: Measuring standalone risk using realized data *please explain how you found the standard deviation of HDSs historical return* Assignment 08 - Risk and Rates of
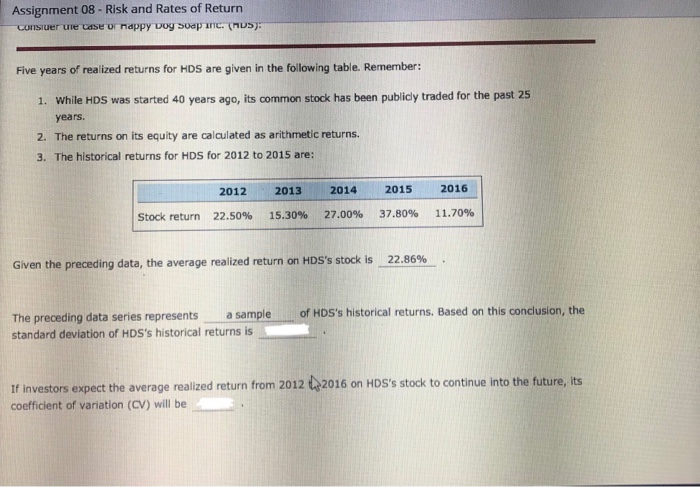
Assignment 08 - Risk and Rates of Return Five years of realized returns for HDS are given in the following table. Remember: 1. While HDS was started 40 years ago, its common stock has been publidy traded for the past 25 years 2. The returns on its equity are calculated as arithmetic returns 3. The historical returns for HDS for 2012 to 2015 are: 2012 2013 20 14 2015 2016 Stock return 22.50% 15.30% 27.00% 37.80% 11.70% Given the preceding data, the average realized return on HDS's stock is 22.86% a sample of HDS's historical returns. Based on this conclusion, the The preceding data series represents sample standard deviation of HDS's historical returns is resents If investors expect the average realized return from 2012 p2016 on HDS's stock to continue into the future, its coefficient of variation (CV) will be
Step by Step Solution
There are 3 Steps involved in it

Get step-by-step solutions from verified subject matter experts