

Question: Mechanical sieve analysis has been performed in a soil sample and following table shows some of the results. a ) Complete the total chart by
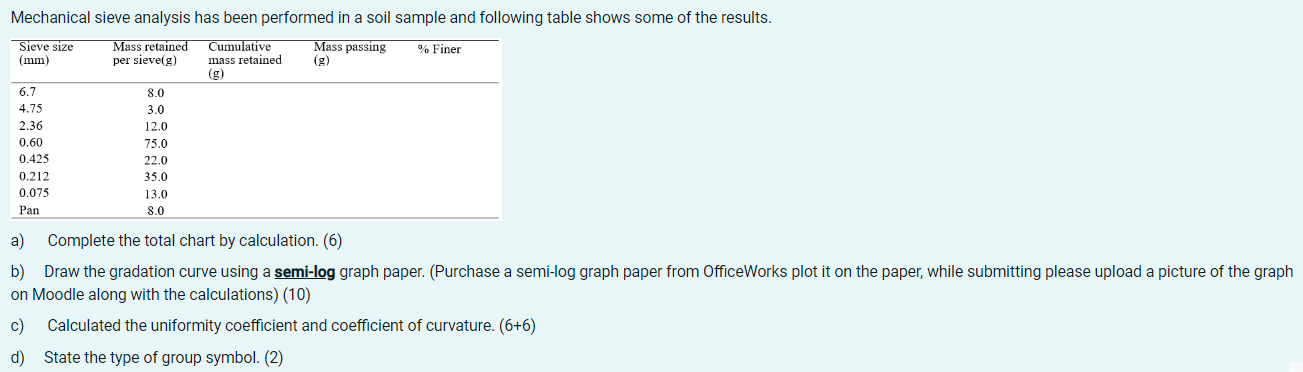
Mechanical sieve analysis has been performed in a soil sample and following table shows some of the results. a Complete the total chart by calculation.
b Draw the gradation curve using a semilog graph paper. Purchase a semilog graph paper from OfficeWorks plot it on the paper, while submitting please upload a picture of the graph on Moodle along with the calculations
c Calculated the uniformity coefficient and coefficient of curvature.
d State the type of group symbol. Mechanical sieve analysis has been performed in a soil sample and following table shows some of the results.
a Complete the total chart by calculation.
b Draw the gradation curve using a semilog graph paper. Purchase a semilog graph paper from OfficeWorks plot it on the paper, while submitting please upload a picture of the graph
on Moodle along with the calculations
c Calculated the uniformity coefficient and coefficient of curvature.
d State the type of group symbol.
Step by Step Solution
There are 3 Steps involved in it
1 Expert Approved Answer
Step: 1 Unlock

Question Has Been Solved by an Expert!
Get step-by-step solutions from verified subject matter experts
Step: 2 Unlock
Step: 3 Unlock