

Question: medium variability high variability low variability M Figure 2. Three scenarios for differences between means. Consider the graph below. In which case is the statistical
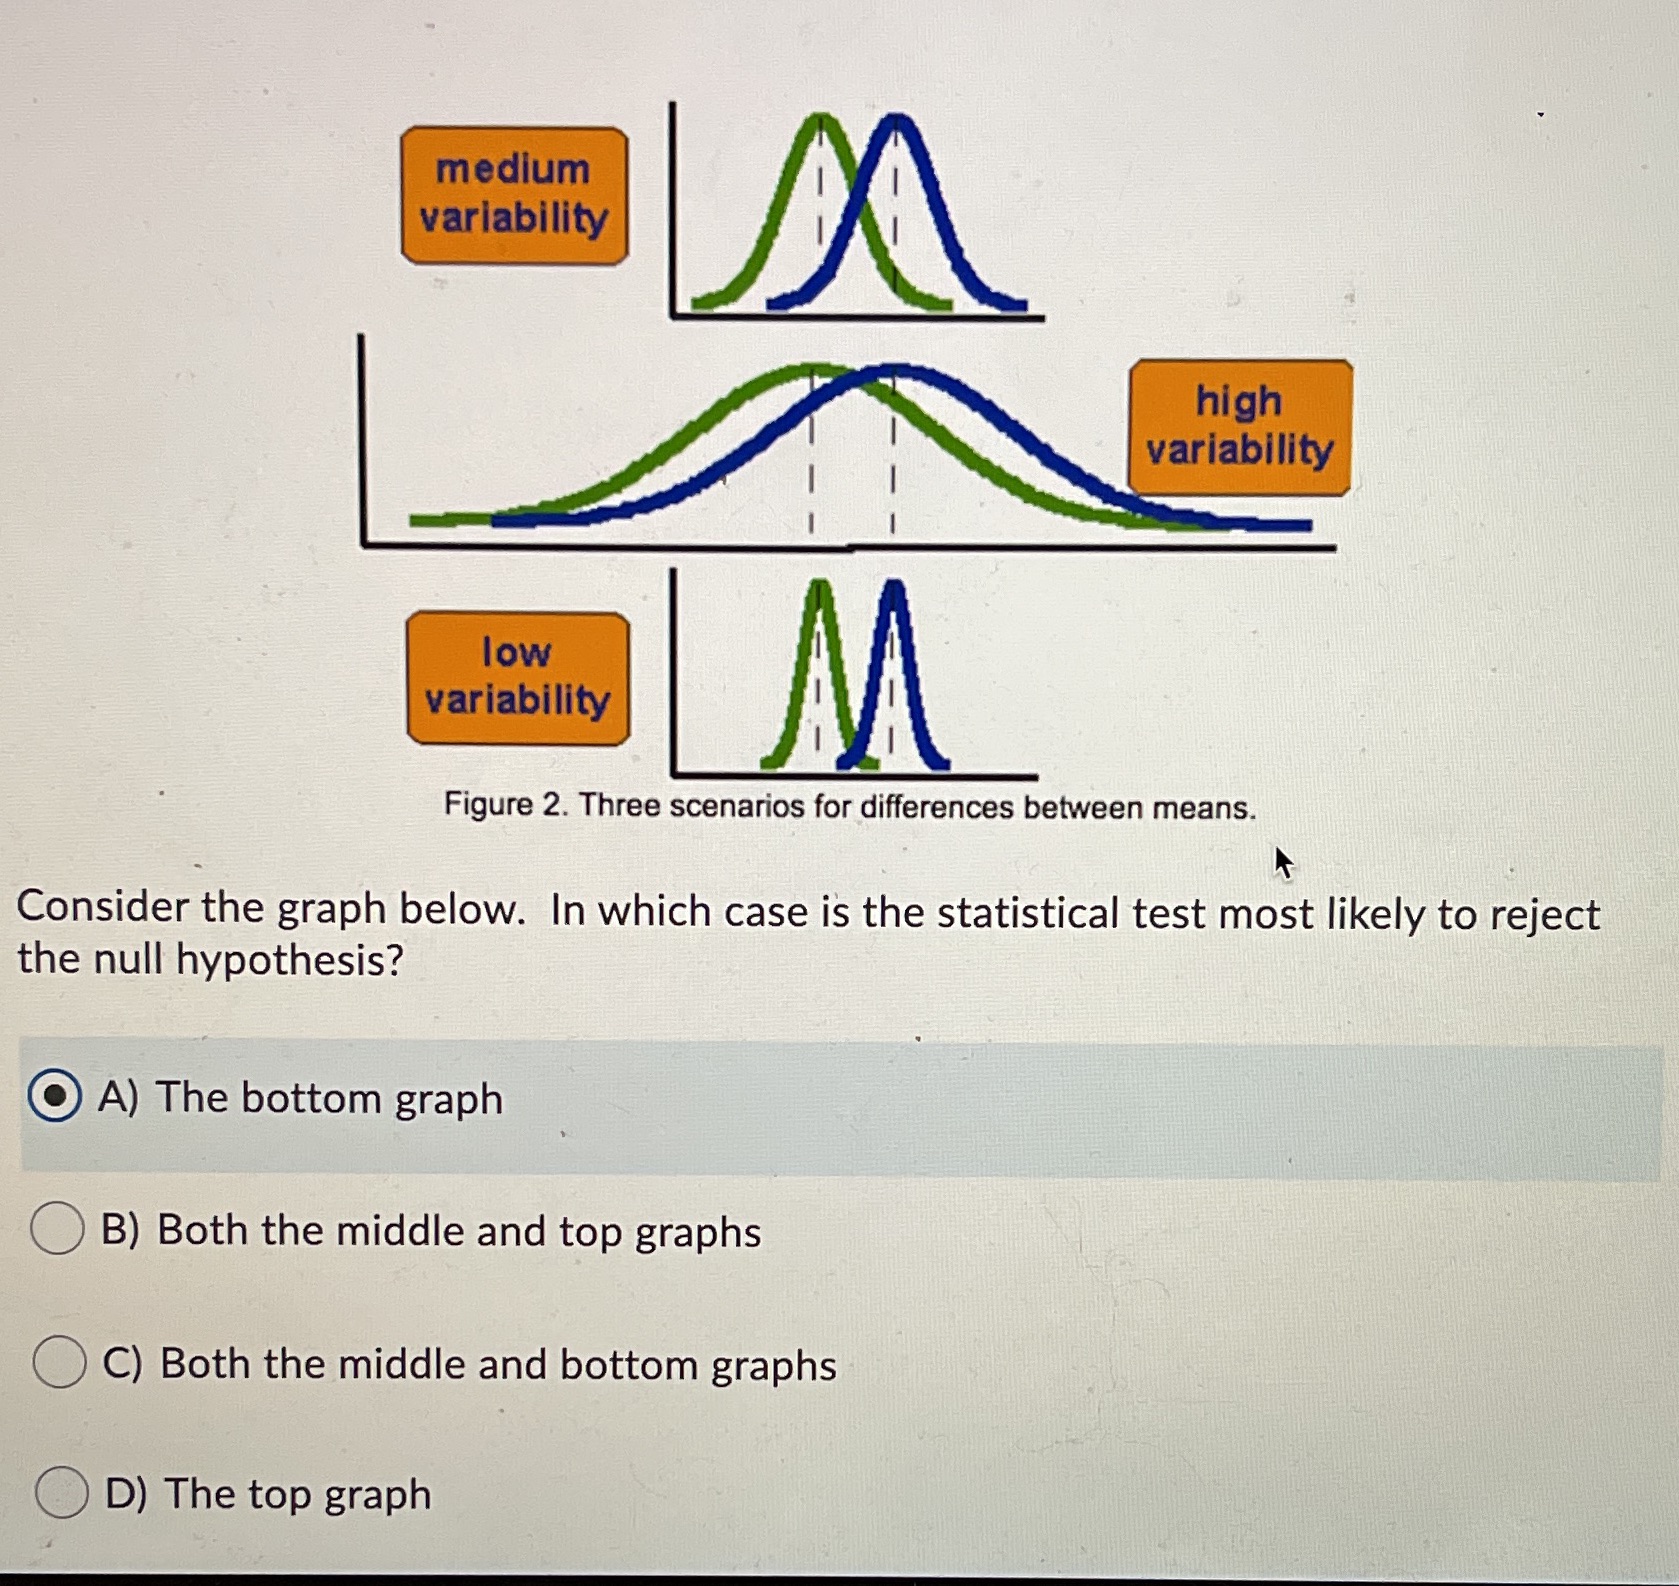
medium variability high variability low variability M Figure 2. Three scenarios for differences between means. Consider the graph below. In which case is the statistical test most likely to reject the null hypothesis? A) The bottom graph (B) Both the middle and top graphs OC) Both the middle and bottom graphs OD) The top graph
Step by Step Solution
There are 3 Steps involved in it
1 Expert Approved Answer
Step: 1 Unlock

Question Has Been Solved by an Expert!
Get step-by-step solutions from verified subject matter experts
Step: 2 Unlock
Step: 3 Unlock