

Question: Memory: 200.9 MS 1 Question 5. In the next question, you will be creating a visualization to understand the relationship between birth and death rates.
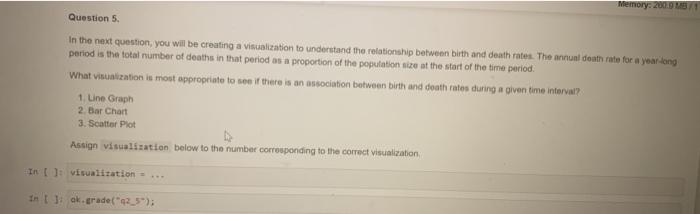
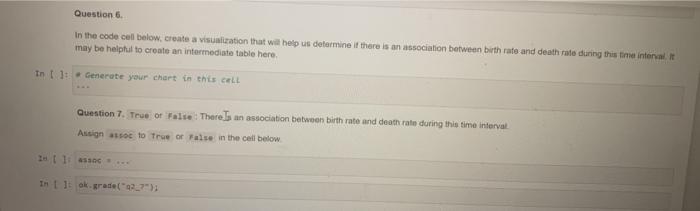
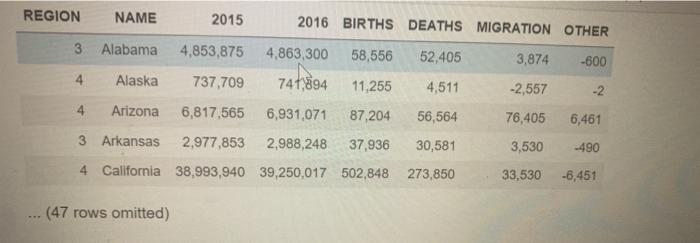
Memory: 200.9 MS 1 Question 5. In the next question, you will be creating a visualization to understand the relationship between birth and death rates. The annun douth rate for a year-long period is the total number of deaths in that period as a proportion of the population size at the start of the time period. What visualization is most appropriate to see if there is an association between birth and death rates during a given time interval? 1 Line Graph 2. Bar Chart 3. Scatter Plot Assign visualization below to the number corresponding to the correct visualization In : visualitation In takrade(2_59); Question 6 In the code cel below, create a visualization that will help us determine if there is an association between birth rate and death rate during this time internal may be helpful to create an intermediate table here In 1: Generate your chart in this call Question 7. True or Faire: There an association between birth rate and death rate during this time interval Assign assoc to True or False in the cell below It lies In L 1 ok. grade(92_7") REGION NAME 2015 2016 BIRTHS DEATHS MIGRATION OTHER 3,874 -600 -2,557 -2 3. Alabama 4,853,875 4,863,300 58,556 52,405 4 Alaska 737,709 747,894 11,255 4,511 4 Arizona 6,817,565 6,931,071 87.204 56,564 3 Arkansas 2,977,853 2,988,248 37,936 30,581 4 California 38,993,940 39,250,017 502,848 273,850 76,405 6,461 3,530 -490 33,530 -6,451 .. (47 rows omitted)
Step by Step Solution
There are 3 Steps involved in it

Get step-by-step solutions from verified subject matter experts