

Question: ment Rate (%) 1 2 4 3 5 6 below. sses the unemployment rate decreases. Please note that this data is graphed a) Calculate
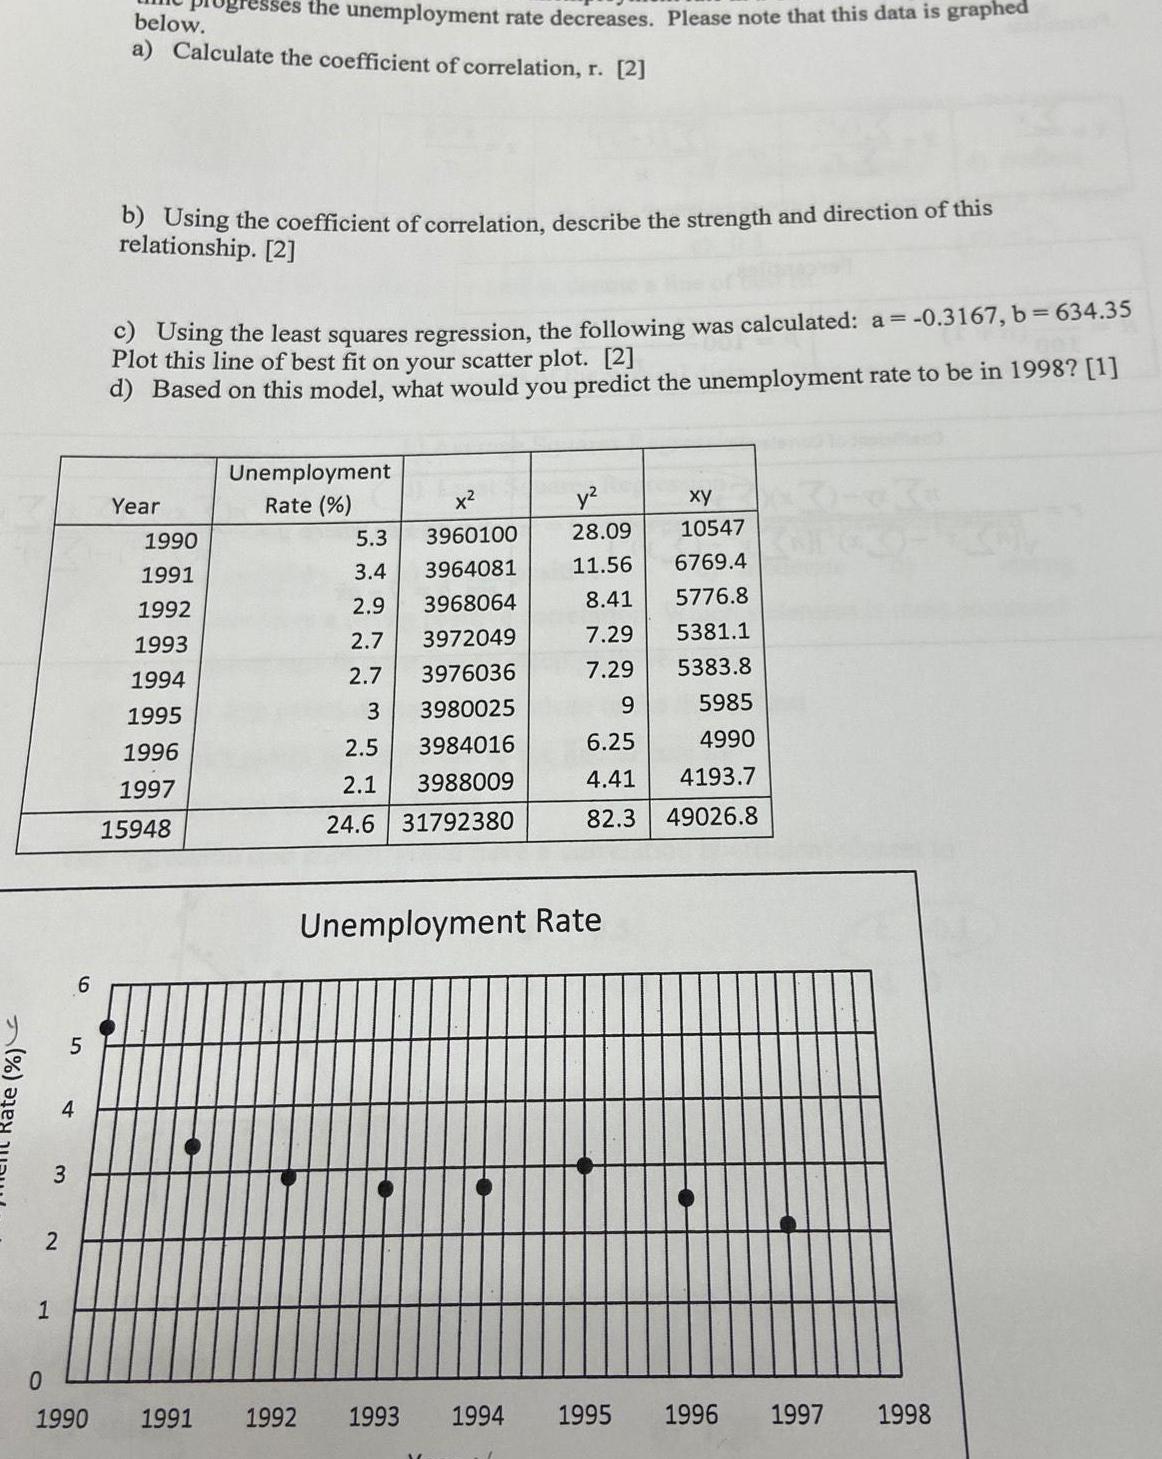
ment Rate (%) 1 2 4 3 5 6 below. sses the unemployment rate decreases. Please note that this data is graphed a) Calculate the coefficient of correlation, r. [2] b) Using the coefficient of correlation, describe the strength and direction of this relationship. [2] c) Using the least squares regression, the following was calculated: a = -0.3167, b = 634.35 Plot this line of best fit on your scatter plot. [2] d) Based on this model, what would you predict the unemployment rate to be in 1998? [1] Year Unemployment Rate (%) x y 1990 5.3 3960100 28.09 10547 1991 3.4 3964081 11.56 6769.4 1992 2.9 3968064 8.41 5776.8 1993 2.7 3972049 7.29 5381.1 1994 2.7 3976036 7.29 5383.8 1995 3 3980025 9 5985 1996 2.5 3984016 6.25 4990 1997 2.1 3988009 4.41 4193.7 15948 24.6 31792380 82.3 49026.8 Unemployment Rate 0 1990 1991 1992 1993 1994 1995 1996 1997 1998
Step by Step Solution
There are 3 Steps involved in it

Get step-by-step solutions from verified subject matter experts