

Question: Mercury is absorbed by fish when they filter water through their gills, and the concentration of mercury in fish meat can be many times greater
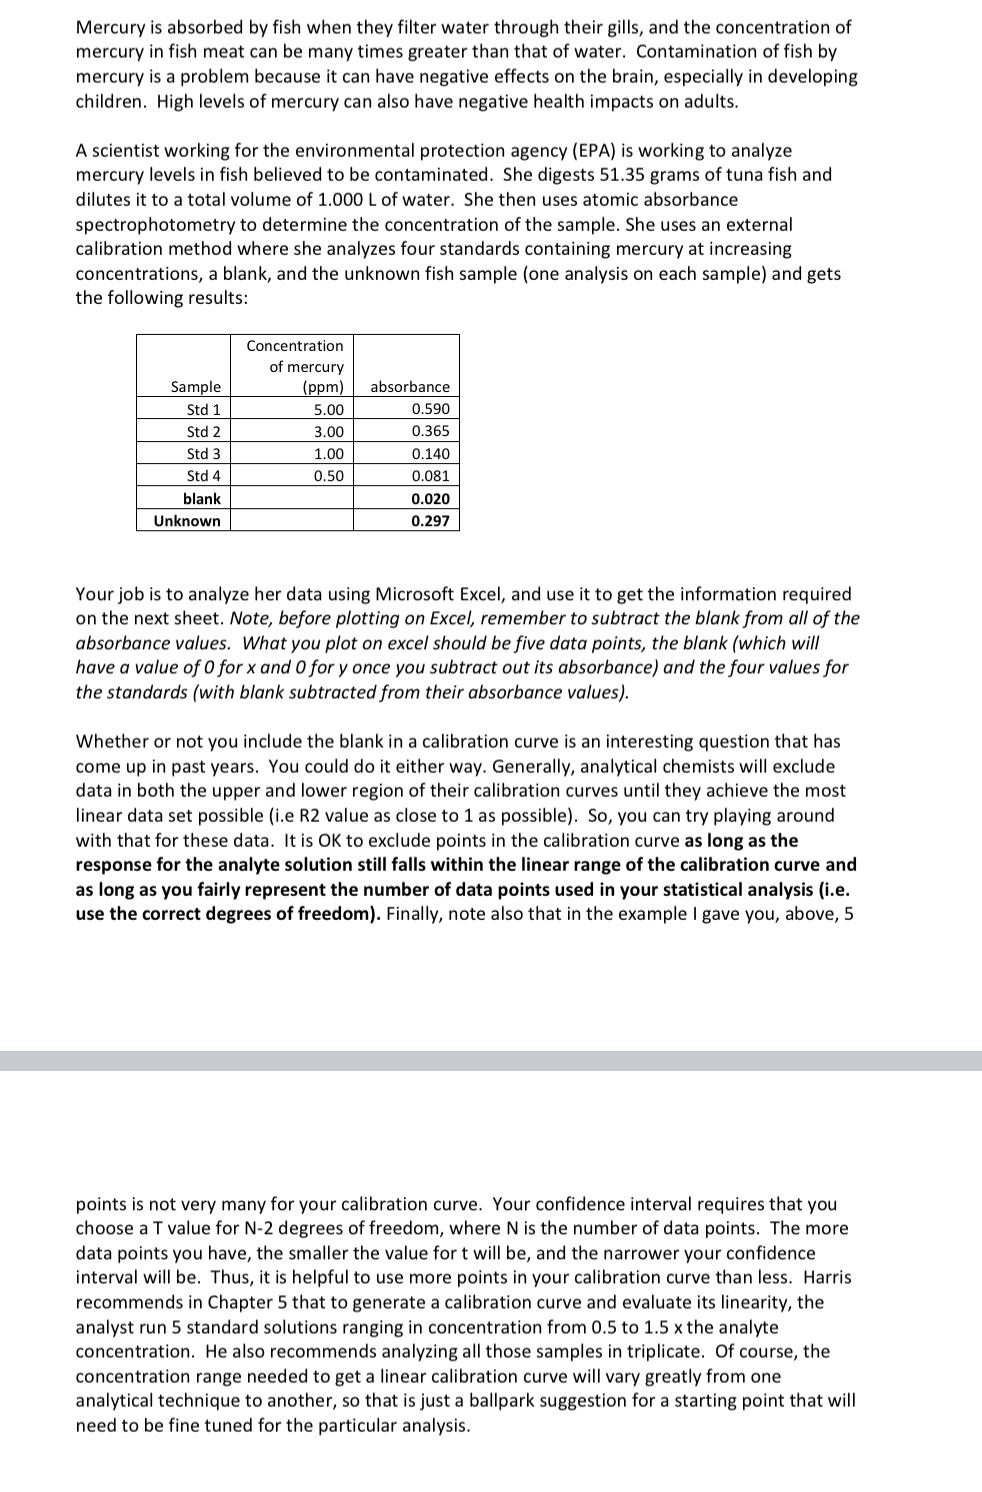
Mercury is absorbed by fish when they filter water through their gills, and the concentration of mercury in fish meat can be many times greater than that of water. Contamination of fish by mercury is a problem because it can have negative effects on the brain, especially in developing children. High levels of mercury can also have negative health impacts on adults. A scientist working for the environmental protection agency (EPA) is working to analyze mercury levels in fish believed to be contaminated. She digests 51.35 grams of tuna fish and dilutes it to a total volume of 1.000 L of water. She then uses atomic absorbance spectrophotometry to determine the concentration of the sample. She uses an external calibration method where she analyzes four standards containing mercury at increasing concentrations, a blank, and the unknown fish sample (one analysis on each sample) and gets the following results: Sample Std 1 Std 2 Std 3 Std 4 blank Unknown Concentration of mercury (ppm) 5.00 3.00 1.00 0.50 absorbance 0.590 0.365 0.140 0.081 0.020 0.297 Your job is to analyze her data using Microsoft Excel, and use it to get the information required on the next sheet. Note, before plotting on Excel, remember to subtract the blank from all of the absorbance values. What you plot on excel should be five data points, the blank (which will have a value of 0 for x and O for y once you subtract out its absorbance) and the four values for the standards (with blank subtracted from their absorbance values). Whether or not you include the blank in a calibration curve is an interesting question that has come up in past years. You could do it either way. Generally, analytical chemists will exclude data in both the upper and lower region of their calibration curves until they achieve the most linear data set possible (i.e R2 value as close to 1 as possible). So, you can try playing around with that for these data. It is OK to exclude points in the calibration curve as long as the response for the analyte solution still falls within the linear range of the calibration curve and as long as you fairly represent the number of data points used in your statistical analysis (i.e. use the correct degrees of freedom). Finally, note also that in the example I gave you, above, 5 points is not very many for your calibration curve. Your confidence interval requires that you choose a T value for N-2 degrees of freedom, where N is the number of data points. The more data points you have, the smaller the value fort will be, and the narrower your confidence interval will be. Thus, it is helpful to use more points in your calibration curve than less. Harris recommends in Chapter 5 that to generate a calibration curve and evaluate its linearity, the analyst run 5 standard solutions ranging in concentration from 0.5 to 1.5 x the analyte concentration. He also recommends analyzing all those samples in triplicate. Of course, the concentration range needed to get a linear calibration curve will vary greatly from one analytical technique to another, so that is just a ballpark suggestion for a starting point that will need to be fine tuned for the particular analysis. . Your calibration curve A copy of the spreadsheet used to calculate the uncertainty of the slope, intercept and concentration (see Harris 10th edition, page 91). This data sheet, filled out below with data from your spreadsheets using the correct number of significant figures (see Harris 10th Edition page 58, "The Real Rule for Significant Figures".) . Hint: A note about significant figures. As a general rule, the uncertainty (in this case the standard deviation) should be reported with 1 or 2 significant figures. The measurement number associated with that uncertainty can then be rounded to the same decimal place (not the same # of significant figures) as the uncertainty. For example, if m (the slope of the calib curve) = 2.3456 and sm (the uncertainty in the slope) = 0.04253, then the proper way to express the slope with uncertainty rounded to 2 significant figures would be: 2.346 + 0.042. It would also be acceptable to round the uncertainty to only 1 significant figure, i.e. 2.35 +0.04. I will accept answers where the uncertainty is rounded to 1 or 2 significant figures, just be consistent and be sure that the measurement number matches the decimal of the uncertainty. It is NOT acceptable to use more than 2 significant figures in the uncertainty. 2 1. Slope of calibration curve (m) 2. Uncertainty of slope (sm) 3. Intercept of calibration curve (b) 4. Uncertainty of intercept (sb) 5. Concentration of mercury in the water sample (ppm) 6. Uncertainty in concentration of mercury in water (sx) (ppm) 7. Concentration of mercury in the tuna (in mg/kg) 8. Uncertainty in conc. of mercury in the tuna (mg/kg) 9. 95% confidence interval for concentration of mercury in tuna (mg/kg)* =
Step by Step Solution
There are 3 Steps involved in it

Get step-by-step solutions from verified subject matter experts