

Question: Message Board Assignment (Ch5) 4) Consider the graph to the right. Grassland butterflies - population index (1990 = 100) It comes from the article The
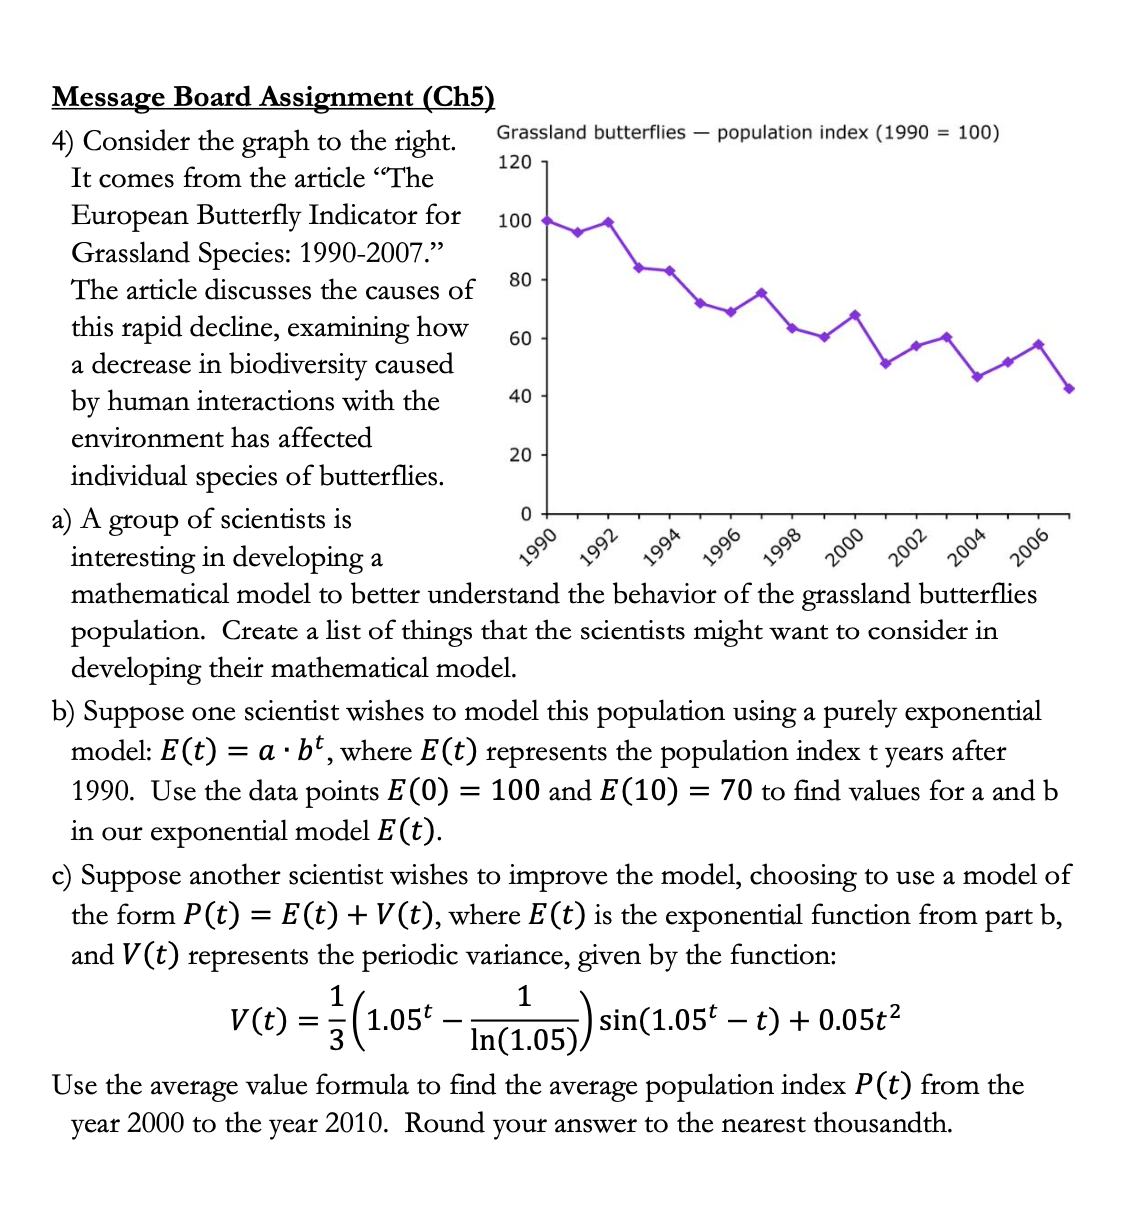
Message Board Assignment (Ch5) 4) Consider the graph to the right. Grassland butterflies - population index (1990 = 100) It comes from the article "The 120 European Butterfly Indicator for 100 Grassland Species: 1990-2007." The article discusses the causes of 80 this rapid decline, examining how 60 a decrease in biodiversity caused by human interactions with the 40 environment has affected 20 individual species of butterflies. a) A group of scientists is interesting in developing a 990 1992 1994 199 1998 2000 2002 06 200 20 mathematical model to better understand the behavior of the grassland butterflies population. Create a list of things that the scientists might want to consider in developing their mathematical model. b) Suppose one scientist wishes to model this population using a purely exponential model: E(t) = a . b', where E(t) represents the population index t years after 1990. Use the data points E(0) = 100 and E (10) = 70 to find values for a and b in our exponential model E (t). c) Suppose another scientist wishes to improve the model, choosing to use a model of the form P(t) = E(t) + V(t), where E (t) is the exponential function from part b, and V(t) represents the periodic variance, given by the function: V(t) = =1.05t - 1 In (1.05)/ sin(1.05t - t) + 0.05t2 Use the average value formula to find the average population index P(t) from the year 2000 to the year 2010. Round your answer to the nearest thousandth
Step by Step Solution
There are 3 Steps involved in it

Get step-by-step solutions from verified subject matter experts