

Question: Method Participants This research a quantitative study using a correlational design to investigate the relationship between time spent on social media and GPA scores of
Method
Participants This research a quantitative study using a correlational design to investigate the relationship between time spent on social media and GPA scores of post-graduates. Participants in this research will be college students who are presently enrolled in a higher education school. A convenience sampling technique be used to pick the candidates. Students must be active social media users, spending at least one hour per day on social media sites, in order to participate in the research. Participants will be recruited via a variety of methods, including social media platforms, email, and flyers placed on campus bulletin boards. The research will have a sample size of 300 people. The study's participants were all at least 18 years old and registered in either undergraduate or graduate education.
Materials
This study's resources will include a survey questionnaire that will be conducted online. The evaluation was be split into three sections: the first will collect personal information about the subjects, the second will collect information about their social media usage, and the third collected information about their GPA scores. Two surveys be used in the research. The first inquiry collected demographic data such as age, gender, and scholastic subject. The second poll was looked at how much time people spend on social media sites like Facebook, Twitter, Instagram, and Snapchat. Participants will be asked to identify the typical number of hours they spend per day on each site.
Procedure
The study be carried out in two stages. Participants be recruited in the first step from a major public institution in the United States. Participants will be notified via email and social media platforms. Before completing the assessment, subjects be given a consent document. Participants who give their permission be requested to complete an online assessment. The identities of the individuals will be kept private. The data will be analyzed using different statistical methods in the second step. To find patterns and trends, the data will be examined using descriptive statistics. To evaluate theories and investigate relationships between variables, inferential statistics will be used.
Data Analysis
Data will be analyzed using various statistical methods. Descriptive statistics will be used toosummarize the data and identify patterns and trends. The inferential statistics will be used to test hypotheses and examine the relationships between variables. The following statistical methods will be used to analyze the data: Correlation analysis: A correlation analysis will be performed to examine the relationship between the time spent on social media and the GPA Scores of college students. Regression analysis: A regression analysis will be performed to identify the relationship between the time spent on social media and GPA Scores while controlling for demographic variables. ANOVA: An ANOVA analysis will be performed to examine the differences in GPA Scores across different levels of social media usage while controlling for demographic variables. Structural Equation Modeling: A structural equation modeling (SEM) analysis will be performed to examine the relationships between social media usage, academic engagement, and academic achievement.
HEPL with the result, Writing the results for this method? tell me the results of your analyses?
EXample
Results: The Results section contains all of the results, but no conclusions. The order of presentation of results is usually descriptive statistics, followed by demographic analyses, and then finally inferential statistics. The results should also be presented in the order that they are found when you calculate them, for example, an F score before a post hoc test result.
Descriptive Data: In the present report we have placed all of our descriptive data in the methods section with the measures. If they are not reported in the methods section, then descriptive data must be reported here. These results could be reported in a single table or as text if there is only a small amount of data to report.
Main Analyses: When you report results you should restate the hypothesized relationship(s) between the variables of interest, tell what statistics (parameters) were used to test this hypothesis, report the results of the test(s), and then explain what the results mean by talking about people and their behavior.
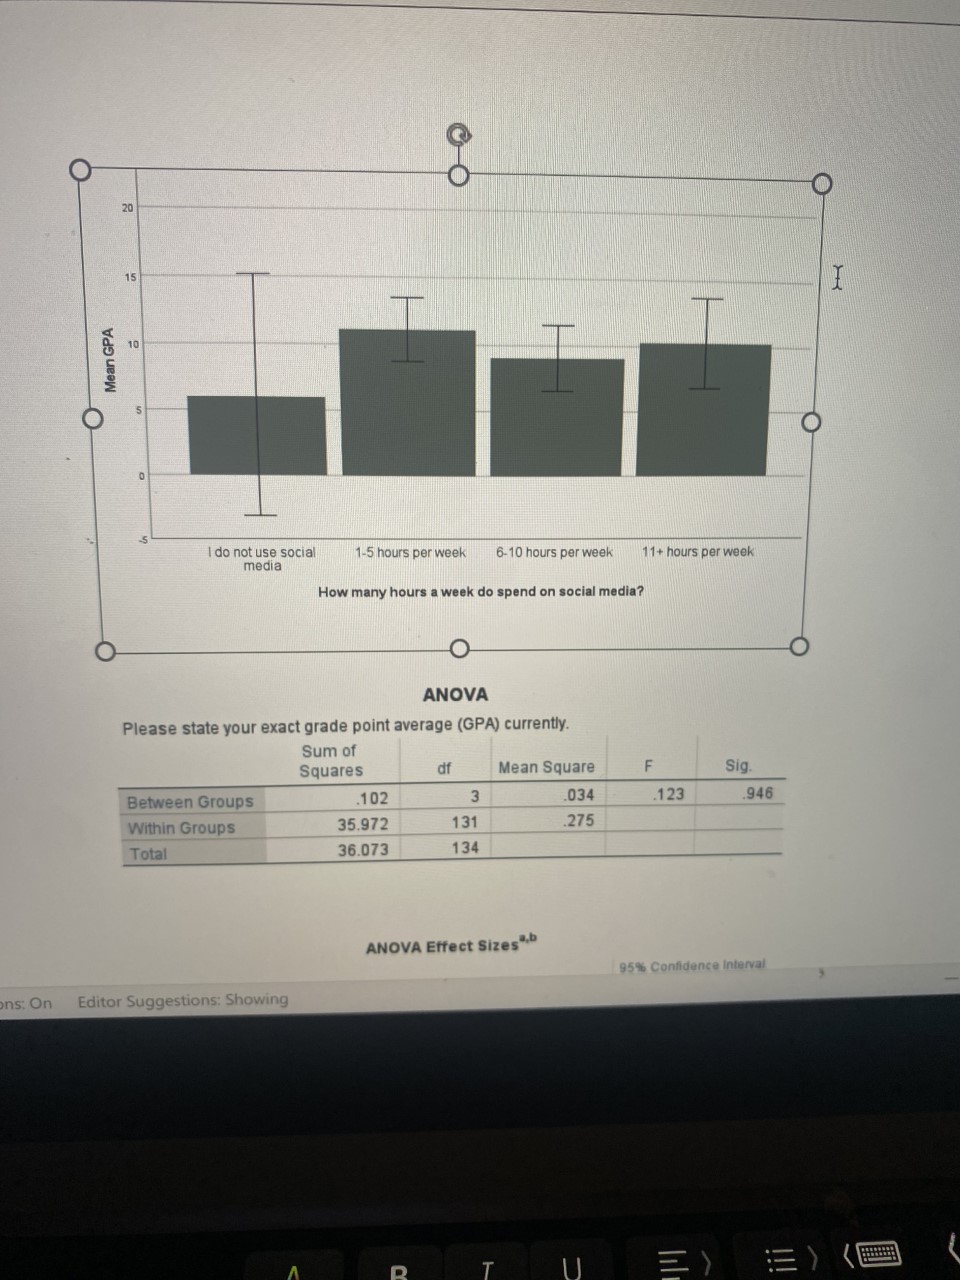
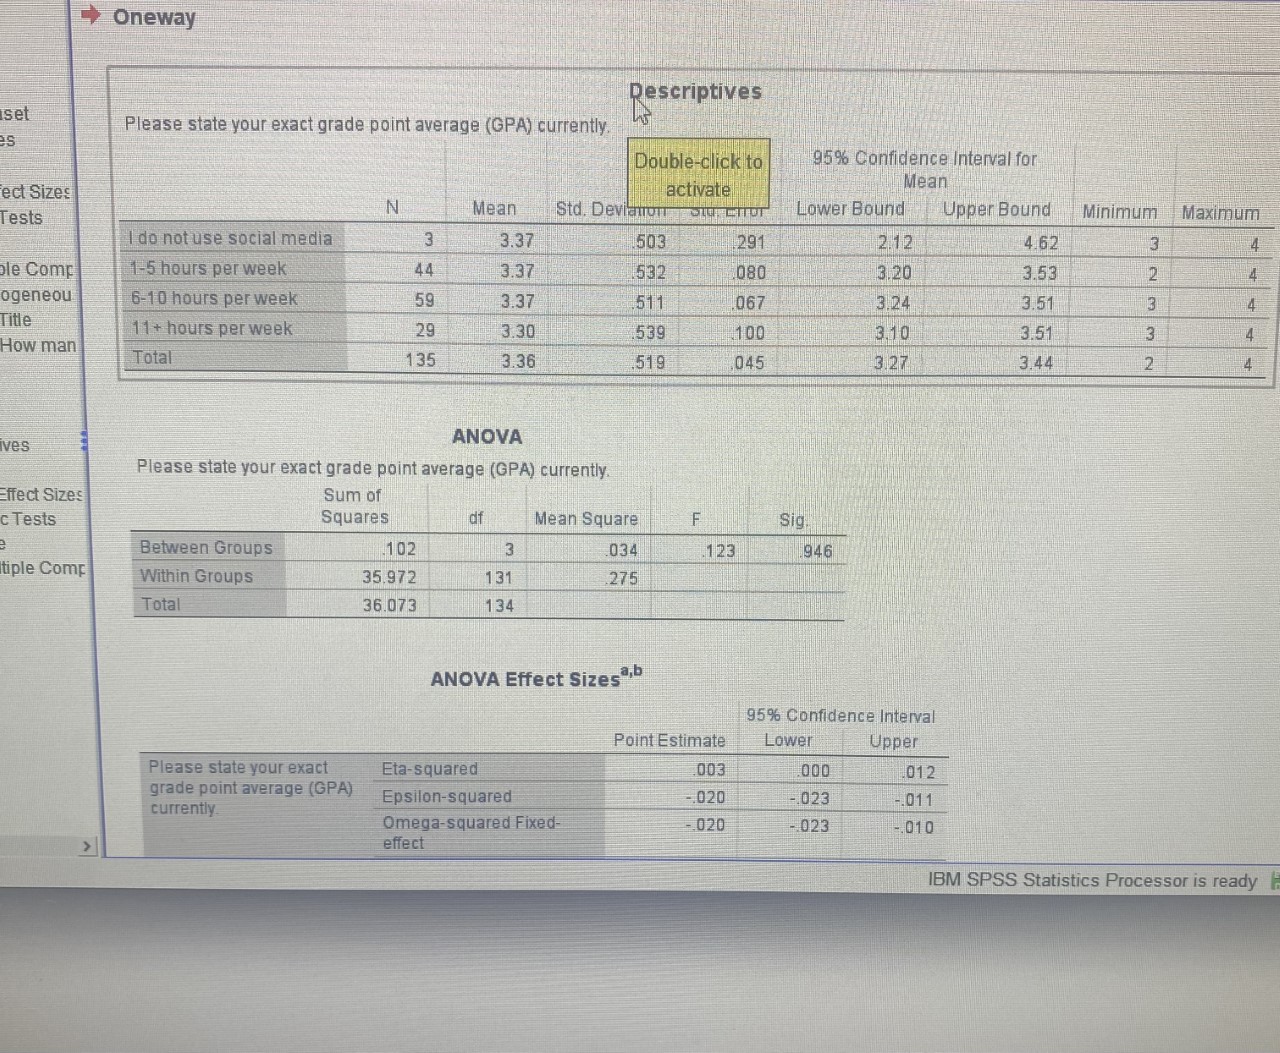
20 15 T 10 Mean GPA O O I do not use social 1-5 hours per week 6-10 hours per week 11+ hours per week media How many hours a week do spend on social media? O ANOVA Please state your exact grade point average (GPA) currently. Sum of Squares df Mean Square F Sig. Between Groups 102 3 .034 123 946 Within Groups 35.972 131 .275 Total 36.073 134 ANOVA Effect Sizes",b 95% Confidence Interval ons: On Editor Suggestions: Showing D T EYOneway Descriptives set Please state your exact grade point average (GPA) currently Double-click to 95% Confidence Interval for ect Sizes activate Mean N Mean Tests Std. Devianow Lower Bound Upper Bound Minimum Maximum I do not use social media 3 3.37 603 29 2.12 4.62 le Comp 1-5 hours per week 44 3.37 532 080 3.20 3.53 ogeneou 6-10 hours per week 59 3.37 511 067 3.24 3.51 Title 11 + hours per week 29 3.30 539 100 3.10 3.5 3 How man Total 135 3.36 519 045 3 27 3.44 2 4 ANOVA ives Please state your exact grade point average (GPA) currently. Effect Sizes Sum of Tests Squares Mean Square F Sig. Between Groups 102 3 034 123 946 tiple Comp Within Groups 35.972 131 275 Total 36.073 134 ANOVA Effect Sizes ,b 95% Confidence Interval Point Estimate Lower Upper Please state your exact Eta-squared 003 000 012 grade point average (GPA) Epsilon-squared .020 -.023 -.011 currently Omega-squared Fixed- 020 -023 -.010 effect IBM SPSS Statistics Processor is ready
Step by Step Solution
There are 3 Steps involved in it

Get step-by-step solutions from verified subject matter experts