

Question: Method_1 Method_2 Method_3 1 11.381 7.891 6.694 2 6.531 12.047 7.527 3 10.78 8.111 7.333 4 11.506 7.341 11.229 5 11.469 9.043 5.222 6 13.833
| Method_1 | Method_2 | Method_3 | |
| 1 | 11.381 | 7.891 | 6.694 |
| 2 | 6.531 | 12.047 | 7.527 |
| 3 | 10.78 | 8.111 | 7.333 |
| 4 | 11.506 | 7.341 | 11.229 |
| 5 | 11.469 | 9.043 | 5.222 |
| 6 | 13.833 | 12.24 | 10.38 |
| 7 | 10.47 | 8.775 | 11.606 |
| 8 | 9.596 | 12.52 | 6.515 |
| 9 | 7.949 | 11.866 | 7.264 |
| 10 | 12.046 | 9.382 | 6.636 |
| 11 | 8.14 |
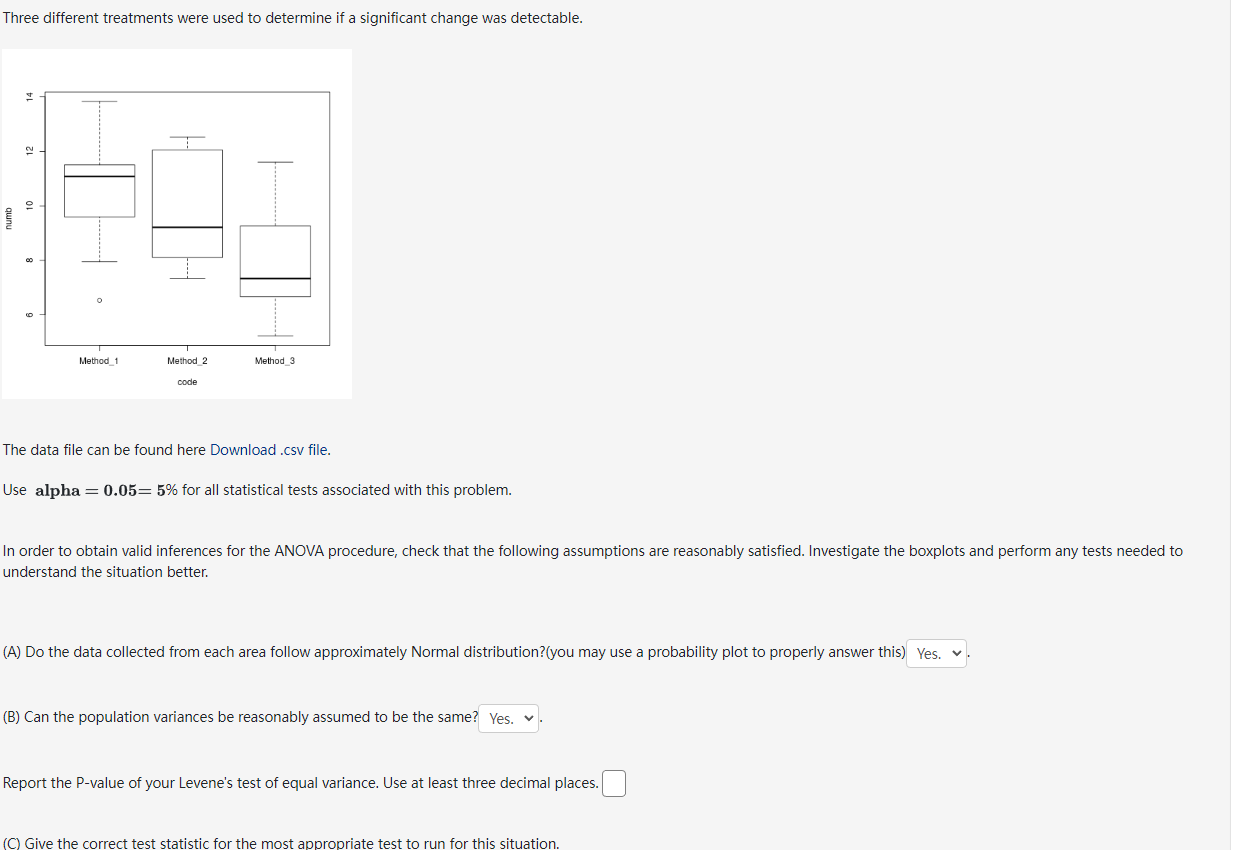
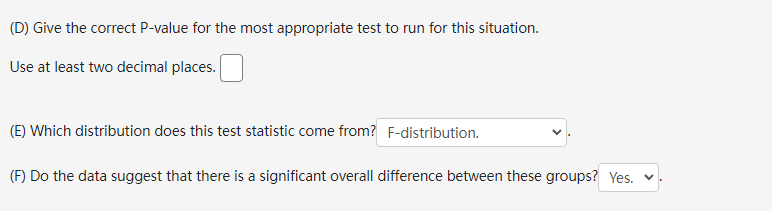
Three different treatments were used to determine if a signicant change was detectable. in 12 W numb Married 1 Method 2 Method 3 The data file can be found here Download .csv file. Use alpha : 0,05: 5% for all statistical tests associated with this problem. In order to obtain valid inferences forthe ANOVA procedure, check that the following assumptions are reasonably satisfied. Investigate the boxplots and perform any tests needed to understand the situation better [A] Do the data collected from each area follow approximately Normal distribution?{you may use a probability plot to properly answerthis) Veg, v . [B] Can the population variances be reasonably assumed to be the same? ye; v . Report the PValue of your Levene's test of equal variance. Use at least three decimal placesl I EC) Give the correct test statistic for the most appropriate test to run for this situation. (D) Give the correct P-value for the most appropriate test to run for this situation. Use at least two decimal places. (E) Which distribution does this test statistic come from? F-distribution. (F) Do the data suggest that there is a significant overall difference between these groups? Yes. v
Step by Step Solution
There are 3 Steps involved in it

Get step-by-step solutions from verified subject matter experts