

Question: Methods https://phet.color Procedure Describe how to use the virtual lab Click on Sound Select a continuous wave (lower left side), click on Graph and pull
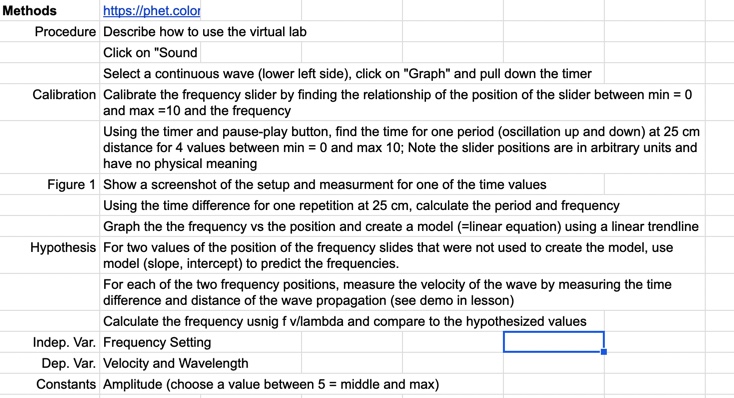

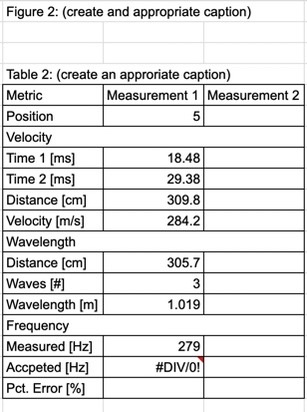

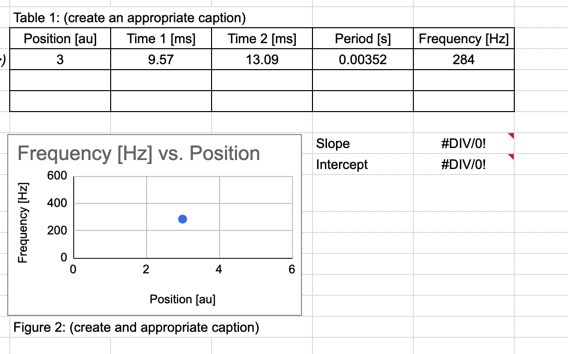

Methods https://phet.color Procedure Describe how to use the virtual lab Click on "Sound Select a continuous wave (lower left side), click on "Graph" and pull down the timer Calibration Calibrate the frequency slider by finding the relationship of the position of the slider between min = 0 and max =10 and the frequency Using the timer and pause-play button, find the time for one period (oscillation up and down) at 25 cm distance for 4 values between min = 0 and max 10; Note the slider positions are in arbitrary units and have no physical meaning Figure 1 Show a screenshot of the setup and measurment for one of the time values Using the time difference for one repetition at 25 cm, calculate the period and frequency Graph the the frequency vs the position and create a model (=linear equation) using a linear trendline Hypothesis For two values of the position of the frequency slides that were not used to create the model, use model (slope, intercept) to predict the frequencies. For each of the two frequency positions, measure the velocity of the wave by measuring the time difference and distance of the wave propagation (see demo in lesson) Calculate the frequency usnig f v/lambda and compare to the hypothesized values Indep. Var. Frequency Setting Dep. Var. Velocity and Wavelength Constants Amplitude (choose a value between 5 = middle and max)Table 1: (create an appropriate caption) Position [au] Time 1 [ms] Time 2 [ms] Period [s] Frequency [Hz] 3 9.57 13.09 0.00352 284 Frequency [Hz] vs. Position Slope #DIV/O! Intercept #DIV/O! 600 400 Frequency [Hz] 200 0 2 6 Position [au] Figure 2: (create and appropriate caption)Figure 2: (create and appropriate caption) Table 2: (create an approriate caption) Metric Measurement 1 Measurement 2 Position 5 Velocity Time 1 [ms] 18.48 Time 2 [ms] 29.38 Distance [cm] 309.8 Velocity [m/s] 284.2 Wavelength Distance [cm] 305.7 Waves [#] Wavelength [m] 1.019 Frequency Measured [Hz] 279 Accpeted [Hz] #DIV/O! Pct. Error [%]
Step by Step Solution
There are 3 Steps involved in it

Get step-by-step solutions from verified subject matter experts