

Question: MGMT 2023 Group Assignment -Semester 1, 2021 ISSUE DATE: March 1, 2022, DUE DATE: March 30, 2022 INSTRUCTIONS TO CANDIDATES: 1 There are nine sections

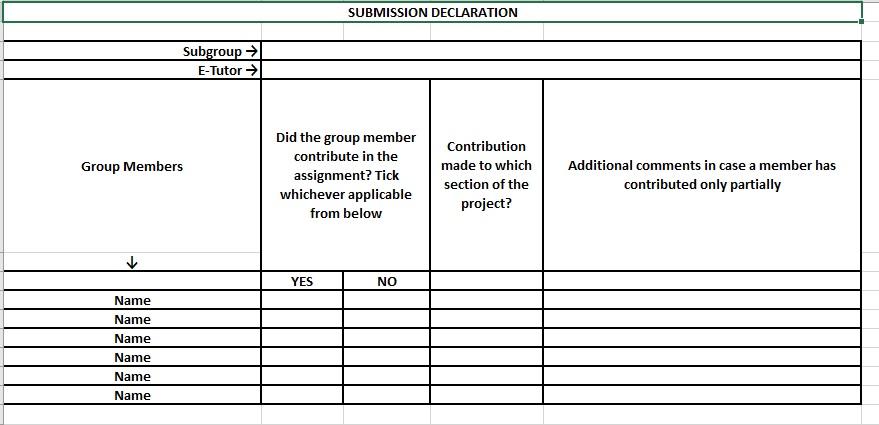
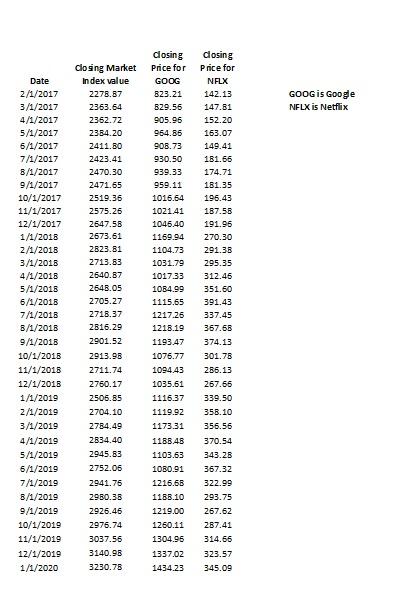
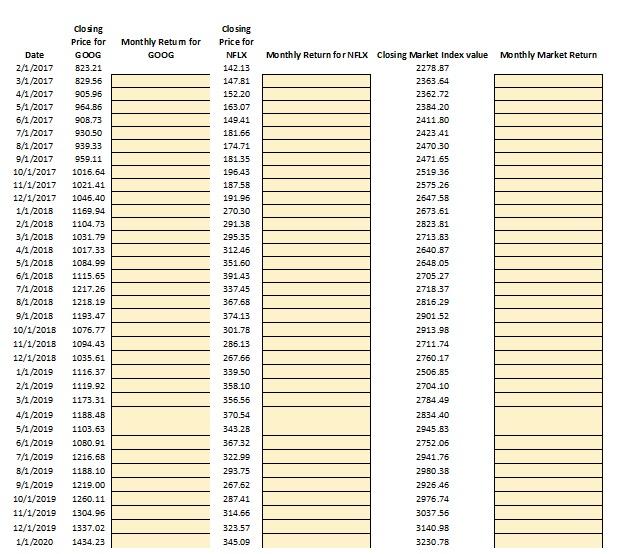
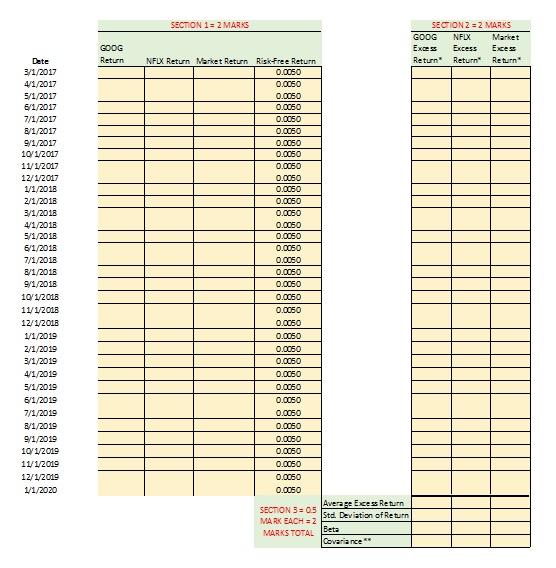
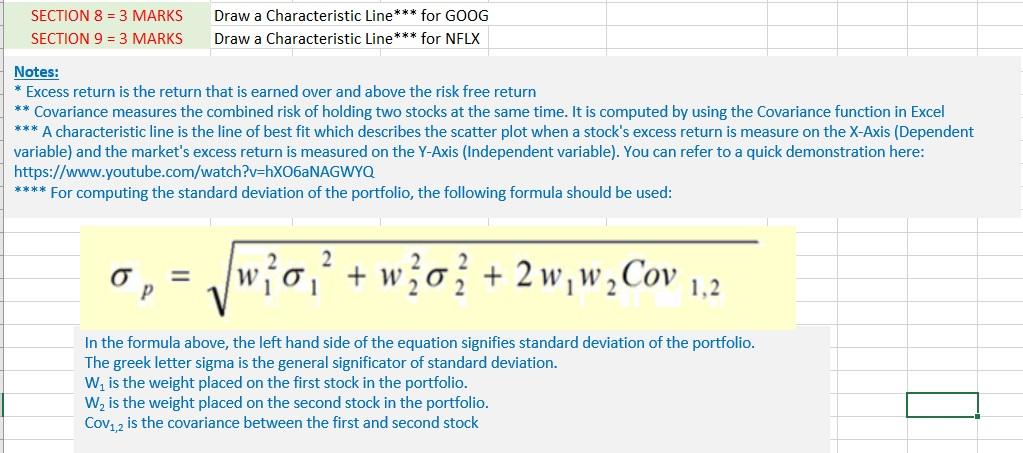
MGMT 2023 Group Assignment -Semester 1, 2021 ISSUE DATE: March 1, 2022, DUE DATE: March 30, 2022 INSTRUCTIONS TO CANDIDATES: 1 There are nine sections in this assignment. All sections are compulsory. 2 Use the data provided in Sheet 3 named "Raw Data" to complete the missing items in the sheets 4 and 5 named "Monthly Return Template and "Solution Template" respectively. The use of calculators and Excel functions is permitted. 3 Candidates are required to work in groups of not more than six persons. 4 Each group must indicate a group leader. The group leader is responsible for coordinating group activity, communication with the e-tutor/CC and the final submission. 5 The group leader/submitter must complete and sign the submission declaration form on Sheet 2 of this Workbook 6 Completed assignment must be submitted to the designated dropbox on the Learning Exchange. No email submissions are allowed. 7 The last date for submission is March 30, 2022 8 Late submissions attract late submission penalty as per guidelines specified in the course guide. Plan your work in advance so as to prevent such an eventuality. 9 Plagiarism in any form is a serious offense and applicable penalty will be applied as per UWI plagiarism policy if any part of your work is plagiarized. 10 This graded activity is worth 20% of the total course assessment. SUBMISSION DECLARATION Subgroup E-Tutor Group Members Did the group member contribute in the assignment? Tick whichever applicable from below Contribution made to which section of the project? Additional comments in case a member has contributed only partially YES NO Name Name Name Name Name Name GOOG is Google NFLX is Netflix Date 2/1/2017 3/1/2017 4/1/2017 5/1/2017 6/1/2017 7/1/2017 B/1/2017 9/1/2017 10/1/2017 11/1/2017 12/1/2017 1/1/2018 2/1/2018 3/1/2018 4/1/2018 5/1/2018 6/1/2018 7/1/2018 B/1/2018 9/1/2018 10/1/2018 11/1/2018 12/1/2018 1/1/2019 2/1/2019 3/1/2019 4/1/2019 5/1/2019 6/1/2019 7/1/2019 8/1/2019 9/1/2019 10/1/2019 11/1/2019 12/1/2019 1/1/2020 closing Market Index value 2278.87 2363.64 2362.72 2384.20 2411.80 2423.41 2470.30 2471.65 2519.36 2575.26 2647.58 2673.61 2823.81 2713.63 2640.87 2648.05 2705.27 2718.37 2816.29 2901.52 2913.98 2711.74 2760.17 2505.85 2704.10 2784.49 2834.40 2945.83 2752.05 2941.75 2980.38 2926.46 2976.74 3037.56 3140.98 3230.78 closing Price for GOOG B23.21 829.56 905.95 964.86 906.73 930.50 939.33 959.11 1016.64 1021.41 1045.40 1169.94 1104.73 1031.79 1017.33 1014.99 1115.55 1217.26 1218.19 1193.47 1076.77 1094.43 1035.61 1116.37 1119.92 1173.31 1188.48 1103.63 1080.91 1216.68 1188.10 1219.00 closing Price for NFLX 142.13 147.81 152.20 163.07 149.41 181.66 174.71 181.35 196.43 187.58 191.96 270.30 291.38 295.35 312.45 351.60 391.43 337.45 367.68 374.13 301.78 286.13 267.66 339.50 358.10 356.56 370.54 343.28 367.32 322.99 293.75 267.62 1260.11 1304.95 1337.02 1434.23 287.41 314.66 323.57 345.09 Monthly Retum for GOOG Date 2/1/2017 3/1/2017 4/1/2017 5/1/2017 6/1/2017 7/1/2017 B/1/2017 9/1/2017 10/1/2017 11/1/2017 12/1/2017 1/1/2018 2/1/2018 3/1/2018 4/1/2018 5/1/2018 6/1/2018 7/1/2018 8/1/2018 9/1/2018 10/1/2018 11/1/2018 12/1/2018 1/1/2019 2/1/2019 3/1/2019 4/1/2019 5/1/2019 6/1/2019 7/1/2019 B/1/2019 9/1/2019 10/1/2019 11/1/2019 12/1/2019 1/1/2020 closing Price for GOOG 823.21 829.56 905.96 964.86 908.73 930.50 939.33 959.11 1015.64 1021.41 1046.40 1169.94 1104.73 1031.79 1017.33 1084.99 1115.65 1217.26 1216.19 1193.47 1076.77 1094.43 1035.61 1116.37 1119.92 1173.31 1188.48 1103.63 1080.91 1216.68 1168.10 1219.00 1260.11 1304.96 1337.02 1434, 23 closing Price for NFLX 142.13 147.81 152.20 163.07 149.41 181.66 174.71 181.35 196.43 187.56 191.96 270.30 291.38 295.35 312.46 351.60 391.43 337.45 367.68 374.13 301.78 286.13 267.66 339.50 358.10 356.56 Monthly Return for NFLX Closing Market Index value Monthly Market Return 2278.67 2363.54 2362.72 2384.20 2411.30 2423 41 2470.30 2471.65 2519.36 2575.26 2647.58 2673.61 2823.81 2713.63 2640.67 2648.05 2705.27 2718.37 2616.29 2901 52 2913.98 2711.74 2760.17 2506.85 2704.10 2784.49 2834.40 2945.83 2752.06 2941.76 2980.38 2926.46 2976.74 3037.56 3140.98 3230.78 370.54 343.28 367.32 322.99 293.75 267.62 28741 314.66 323.57 345.09 GOOG Return Dete 3/1/2017 4/1/2017 5/1/2017 6/1/2017 7/1/2017 8/1/2017 9/1/2017 10/1/2017 11/1/2017 12/1/2017 1/1/2018 2/1/2018 3/1/2018 4/1/2018 5/1/2018 6/1/2018 7/1/2018 8/1/2018 9/1/2018 10/1/2018 11/1/2018 12/1/2018 1/1/2019 2/1/2019 3/1/2019 4/1/2019 5/1/2019 6/1/2019 7/1/2019 8/1/2019 9/1/2019 10/1/2019 11/1/2019 12/1/2019 1/1/2020 SECTION 1 = 2 MARTS SECION 2 = 2 MARKS GOOG NFLX Market Excess Excess Excess NFLX Return Market Return Risk Free Return Return Return Return 0.0050 0.0050 0.0050 0.0050 0.0050 0.0050 0.0050 0.0050 0.0050 0.0050 0.0050 0.0050 0.0050 0.0050 0.0050 0.0050 0.0050 0.0050 0.0050 0.0050 0.0050 0.0050 0.0050 0.0050 0.0050 0.0050 0.0050 0.0050 0.0050 0.0050 0.0050 0.0050 0.0050 0.0050 0.0050 Average Excess Return SECTION 3 = 0.5 Std. Deviation of Return MARK EACH = 2 Beta MARKS TOTAL Covariance SECTION 8 = 3 MARKS SECTION 9 = 3 MARKS Draw a Characteristic Line*** for GOOG Draw a Characteristic Line*** for NFLX Notes: * Excess return is the return that is earned over and above the risk free return ** Covariance measures the combined risk of holding two stocks at the same time. It is computed by using the Covariance function in Excel *** A characteristic line is the line of best fit which describes the scatter plot when a stock's excess return is measure on the X-Axis (Dependent variable) and the market's excess return is measured on the Y-Axis (Independent variable). You can refer to a quick demonstration here: https://www.youtube.com/watch?v=hxO6aNAGWYQ **** For computing the standard deviation of the portfolio, the following formula should be used: 2 2 = Vw wig,' } + wo + 2 w, w, Cov 1,2 2 In the formula above, the left hand side of the equation signifies standard deviation of the portfolio. The greek letter sigma is the general significator of standard deviation. W is the weight placed on the first stock in the portfolio. W, is the weight placed on the second stock in the portfolio. Cov1,2 is the covariance between the first and second stock MGMT 2023 Group Assignment -Semester 1, 2021 ISSUE DATE: March 1, 2022, DUE DATE: March 30, 2022 INSTRUCTIONS TO CANDIDATES: 1 There are nine sections in this assignment. All sections are compulsory. 2 Use the data provided in Sheet 3 named "Raw Data" to complete the missing items in the sheets 4 and 5 named "Monthly Return Template and "Solution Template" respectively. The use of calculators and Excel functions is permitted. 3 Candidates are required to work in groups of not more than six persons. 4 Each group must indicate a group leader. The group leader is responsible for coordinating group activity, communication with the e-tutor/CC and the final submission. 5 The group leader/submitter must complete and sign the submission declaration form on Sheet 2 of this Workbook 6 Completed assignment must be submitted to the designated dropbox on the Learning Exchange. No email submissions are allowed. 7 The last date for submission is March 30, 2022 8 Late submissions attract late submission penalty as per guidelines specified in the course guide. Plan your work in advance so as to prevent such an eventuality. 9 Plagiarism in any form is a serious offense and applicable penalty will be applied as per UWI plagiarism policy if any part of your work is plagiarized. 10 This graded activity is worth 20% of the total course assessment. SUBMISSION DECLARATION Subgroup E-Tutor Group Members Did the group member contribute in the assignment? Tick whichever applicable from below Contribution made to which section of the project? Additional comments in case a member has contributed only partially YES NO Name Name Name Name Name Name GOOG is Google NFLX is Netflix Date 2/1/2017 3/1/2017 4/1/2017 5/1/2017 6/1/2017 7/1/2017 B/1/2017 9/1/2017 10/1/2017 11/1/2017 12/1/2017 1/1/2018 2/1/2018 3/1/2018 4/1/2018 5/1/2018 6/1/2018 7/1/2018 B/1/2018 9/1/2018 10/1/2018 11/1/2018 12/1/2018 1/1/2019 2/1/2019 3/1/2019 4/1/2019 5/1/2019 6/1/2019 7/1/2019 8/1/2019 9/1/2019 10/1/2019 11/1/2019 12/1/2019 1/1/2020 closing Market Index value 2278.87 2363.64 2362.72 2384.20 2411.80 2423.41 2470.30 2471.65 2519.36 2575.26 2647.58 2673.61 2823.81 2713.63 2640.87 2648.05 2705.27 2718.37 2816.29 2901.52 2913.98 2711.74 2760.17 2505.85 2704.10 2784.49 2834.40 2945.83 2752.05 2941.75 2980.38 2926.46 2976.74 3037.56 3140.98 3230.78 closing Price for GOOG B23.21 829.56 905.95 964.86 906.73 930.50 939.33 959.11 1016.64 1021.41 1045.40 1169.94 1104.73 1031.79 1017.33 1014.99 1115.55 1217.26 1218.19 1193.47 1076.77 1094.43 1035.61 1116.37 1119.92 1173.31 1188.48 1103.63 1080.91 1216.68 1188.10 1219.00 closing Price for NFLX 142.13 147.81 152.20 163.07 149.41 181.66 174.71 181.35 196.43 187.58 191.96 270.30 291.38 295.35 312.45 351.60 391.43 337.45 367.68 374.13 301.78 286.13 267.66 339.50 358.10 356.56 370.54 343.28 367.32 322.99 293.75 267.62 1260.11 1304.95 1337.02 1434.23 287.41 314.66 323.57 345.09 Monthly Retum for GOOG Date 2/1/2017 3/1/2017 4/1/2017 5/1/2017 6/1/2017 7/1/2017 B/1/2017 9/1/2017 10/1/2017 11/1/2017 12/1/2017 1/1/2018 2/1/2018 3/1/2018 4/1/2018 5/1/2018 6/1/2018 7/1/2018 8/1/2018 9/1/2018 10/1/2018 11/1/2018 12/1/2018 1/1/2019 2/1/2019 3/1/2019 4/1/2019 5/1/2019 6/1/2019 7/1/2019 B/1/2019 9/1/2019 10/1/2019 11/1/2019 12/1/2019 1/1/2020 closing Price for GOOG 823.21 829.56 905.96 964.86 908.73 930.50 939.33 959.11 1015.64 1021.41 1046.40 1169.94 1104.73 1031.79 1017.33 1084.99 1115.65 1217.26 1216.19 1193.47 1076.77 1094.43 1035.61 1116.37 1119.92 1173.31 1188.48 1103.63 1080.91 1216.68 1168.10 1219.00 1260.11 1304.96 1337.02 1434, 23 closing Price for NFLX 142.13 147.81 152.20 163.07 149.41 181.66 174.71 181.35 196.43 187.56 191.96 270.30 291.38 295.35 312.46 351.60 391.43 337.45 367.68 374.13 301.78 286.13 267.66 339.50 358.10 356.56 Monthly Return for NFLX Closing Market Index value Monthly Market Return 2278.67 2363.54 2362.72 2384.20 2411.30 2423 41 2470.30 2471.65 2519.36 2575.26 2647.58 2673.61 2823.81 2713.63 2640.67 2648.05 2705.27 2718.37 2616.29 2901 52 2913.98 2711.74 2760.17 2506.85 2704.10 2784.49 2834.40 2945.83 2752.06 2941.76 2980.38 2926.46 2976.74 3037.56 3140.98 3230.78 370.54 343.28 367.32 322.99 293.75 267.62 28741 314.66 323.57 345.09 GOOG Return Dete 3/1/2017 4/1/2017 5/1/2017 6/1/2017 7/1/2017 8/1/2017 9/1/2017 10/1/2017 11/1/2017 12/1/2017 1/1/2018 2/1/2018 3/1/2018 4/1/2018 5/1/2018 6/1/2018 7/1/2018 8/1/2018 9/1/2018 10/1/2018 11/1/2018 12/1/2018 1/1/2019 2/1/2019 3/1/2019 4/1/2019 5/1/2019 6/1/2019 7/1/2019 8/1/2019 9/1/2019 10/1/2019 11/1/2019 12/1/2019 1/1/2020 SECTION 1 = 2 MARTS SECION 2 = 2 MARKS GOOG NFLX Market Excess Excess Excess NFLX Return Market Return Risk Free Return Return Return Return 0.0050 0.0050 0.0050 0.0050 0.0050 0.0050 0.0050 0.0050 0.0050 0.0050 0.0050 0.0050 0.0050 0.0050 0.0050 0.0050 0.0050 0.0050 0.0050 0.0050 0.0050 0.0050 0.0050 0.0050 0.0050 0.0050 0.0050 0.0050 0.0050 0.0050 0.0050 0.0050 0.0050 0.0050 0.0050 Average Excess Return SECTION 3 = 0.5 Std. Deviation of Return MARK EACH = 2 Beta MARKS TOTAL Covariance SECTION 8 = 3 MARKS SECTION 9 = 3 MARKS Draw a Characteristic Line*** for GOOG Draw a Characteristic Line*** for NFLX Notes: * Excess return is the return that is earned over and above the risk free return ** Covariance measures the combined risk of holding two stocks at the same time. It is computed by using the Covariance function in Excel *** A characteristic line is the line of best fit which describes the scatter plot when a stock's excess return is measure on the X-Axis (Dependent variable) and the market's excess return is measured on the Y-Axis (Independent variable). You can refer to a quick demonstration here: https://www.youtube.com/watch?v=hxO6aNAGWYQ **** For computing the standard deviation of the portfolio, the following formula should be used: 2 2 = Vw wig,' } + wo + 2 w, w, Cov 1,2 2 In the formula above, the left hand side of the equation signifies standard deviation of the portfolio. The greek letter sigma is the general significator of standard deviation. W is the weight placed on the first stock in the portfolio. W, is the weight placed on the second stock in the portfolio. Cov1,2 is the covariance between the first and second stock
Step by Step Solution
There are 3 Steps involved in it

Get step-by-step solutions from verified subject matter experts