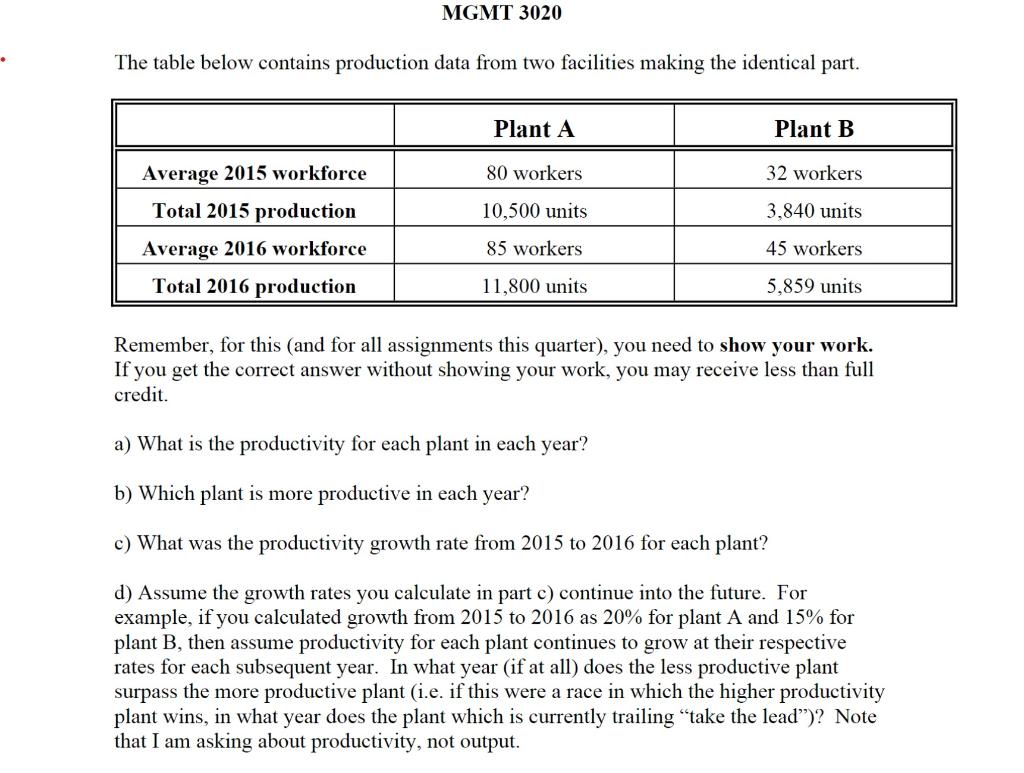
Question: MGMT 3020 The table below contains production data from two facilities making the identical part. Plant A Plant B Average 2015 workforce 80 workers 32

MGMT 3020 The table below contains production

MGMT 3020 The table below contains production data from two facilities making the identical part. Plant A Plant B Average 2015 workforce 80 workers 32 workers Total 2015 production 10,500 units 3,840 units Average 2016 workforce 85 workers 45 workers Total 2016 production 11,800 units 5,859 units Remember, for this and for all assignments this quarter), you need to show your work. If you get the correct answer without showing your work, you may receive less than full credit. a) What is the productivity for each plant in each year? b) Which plant is more productive in each year? c) What was the productivity growth rate from 2015 to 2016 for each plant? d) Assume the growth rates you calculate in part c) continue into the future. For example, if you calculated growth from 2015 to 2016 as 20% for plant A and 15% for plant B, then assume productivity for each plant continues to grow at their respective rates for each subsequent year. In what year (if at all) does the less productive plant surpass the more productive plant (i.e. if this were a race in which the higher productivity plant wins, in what year does the plant which is currently trailing "take the lead")? Note that I am asking about productivity, not output

Step by Step Solution

There are 3 Steps involved in it

1 Expert Approved Answer
Step: 1 Unlock blur-text-image
Question Has Been Solved by an Expert!

Get step-by-step solutions from verified subject matter experts

Step: 2 Unlock
Step: 3 Unlock

Students Have Also Explored These Related General Management Questions!