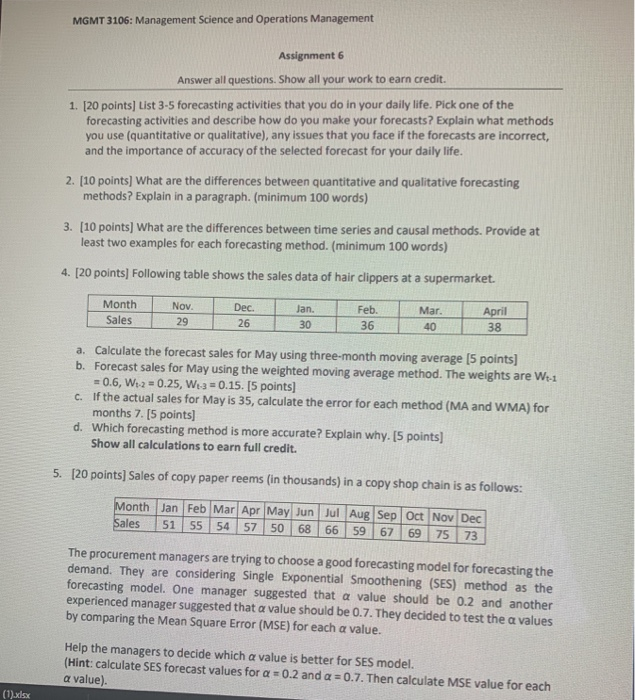
Question: MGMT 3106: Management Science and Operations Management Assignment 6 Answer all questions. Show all your work to earn credit. 1. [20 points) List 3-5 forecasting

MGMT 3106: Management Science and Operations
MGMT 3106: Management Science and Operations Management Assignment 6 Answer all questions. Show all your work to earn credit. 1. [20 points) List 3-5 forecasting activities that you do in your daily life. Pick one of the forecasting activities and describe how do you make your forecasts? Explain what methods you use (quantitative or qualitative), any issues that you face if the forecasts are incorrect, and the importance of accuracy of the selected forecast for your daily life. 2. (10 points) What are the differences between quantitative and qualitative forecasting methods? Explain in a paragraph. (minimum 100 words) 3. [10 points) What are the differences between time series and causal methods. Provide at least two examples for each forecasting method. (minimum 100 words) 4. [20 points) Following table shows the sales data of hair clippers at a supermarket. Month Sales Nov. 29 Mar. Dec. 26 Jan. 30 Feb. 36 April 38 40 a. Calculate the forecast sales for May using three-month moving average [5 points) b. Forecast sales for May using the weighted moving average method. The weights are W1-1 = 0.6, W12 = 0.25, W-3 = 0.15. (5 points) c. If the actual sales for May is 35, calculate the error for each method (MA and WMA) for months 7. [5 points) d. Which forecasting method is more accurate? Explain why. [5 points) Show all calculations to earn full credit. 5. [20 points] Sales of copy paper reems (in thousands) in a copy shop chain is as follows: Month Jan Feb Mar Apr May Jun Jul Aug Sep Oct Nov Dec Sales 51 55 54 57 50 68 66 59 67 69 75 73 The procurement managers are trying to choose a good forecasting model for forecasting the demand. They are considering Single Exponential Smoothening (SES) method as the forecasting model. One manager suggested that a value should be 0.2 and another experienced manager suggested that a value should be 0.7. They decided to test the a values by comparing the Mean Square Error (MSE) for each a value. Help the managers to decide which a value is better for SES model. (Hint: calculate SES forecast values for a=0.2 and a = 0.7. Then calculate MSE value for each a value). (1).xdsx

Step by Step Solution

There are 3 Steps involved in it

1 Expert Approved Answer
Step: 1 Unlock blur-text-image
Question Has Been Solved by an Expert!

Get step-by-step solutions from verified subject matter experts

Step: 2 Unlock
Step: 3 Unlock

Students Have Also Explored These Related General Management Questions!