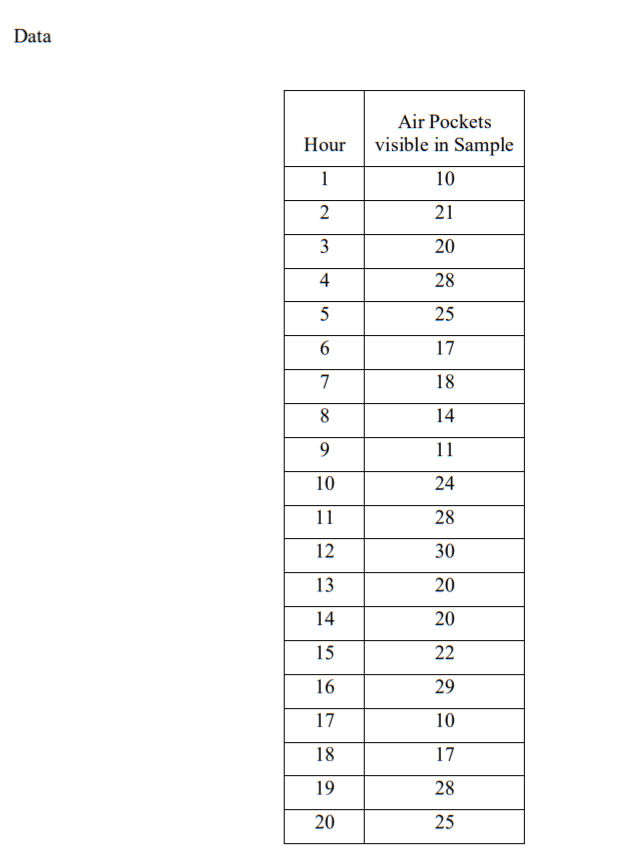
Question: MGMT 4630 SPC Assignment #3 Read the scenario below. Then construct and interpret the appropriate control charts. Exercise Objective: Construct and interpret statistical process control

MGMT 4630 SPC Assignment #3 Read the scenario

MGMT 4630 SPC Assignment #3 Read the scenario

MGMT 4630 SPC Assignment #3 Read the scenario below. Then construct and interpret the appropriate control charts. Exercise Objective: Construct and interpret statistical process control charts. Course Learning Objective: Use a variety of current industry quality tools for measuring and monitoring quality A local factory that products glass panes for industrial windows wants to monitors its production process. One way to evaluate the quality of a piece of glass is to count the number of the small air pockets that can form in the glass during the hot forming process. When there are too many air pockets, then the glass will not look crystal clear. The company plans to take a sample of glass every hour and count the air pockets in a 4-inch by 4-inch section (using a 10 x magnifying glass). The data from the most recent 20 hours of production has been provided (page 2). 1) Which type of control chart is should be used (np, p, c, or u)? Clearly explain why? 2) Develop the appropriate control chart(s) and examine the glass production process. 3) Does the glass production process appear to be stable during the period of time when the observations were made? Explain why or why not. (Consider the run tests, but you do not have to submit a table of those results.) Instructions You may NOT use Excel for performing calculations. Submit your calculations (neat and organized) Submit a very neatly prepared page of handwritten calculations. . . Round all calculations to two (2) decimal places except for p and (if used). Round p and to three (3) decimal places. Plot the control charts using pencil and pen and a straight edge. Make it to scale and neat. The charts must clearly show and label the control limits, the ABC zones and the centerline. The y-axis must be clearly labeled with these components, i.e. show the numeric values. The charts presented in the lecture video represent properly formatted charts. Neatness counts. Data Hour Air Pockets visible in Sample 10 1 2 21 3 20 4 28 5 25 6 17 7 18 8 14 9 11 10 24 11 28 12 30 13 20 14 20 15 22 16 29 17 10 18 17 19 28 20 25

Step by Step Solution

There are 3 Steps involved in it

1 Expert Approved Answer
Step: 1 Unlock blur-text-image
Question Has Been Solved by an Expert!

Get step-by-step solutions from verified subject matter experts

Step: 2 Unlock
Step: 3 Unlock

Students Have Also Explored These Related General Management Questions!