

Question: MGS 3040 MIS - Excel Assignment Instructions For this assignment each team is required to a fictitious stock portfolio by investing a total of $100,000
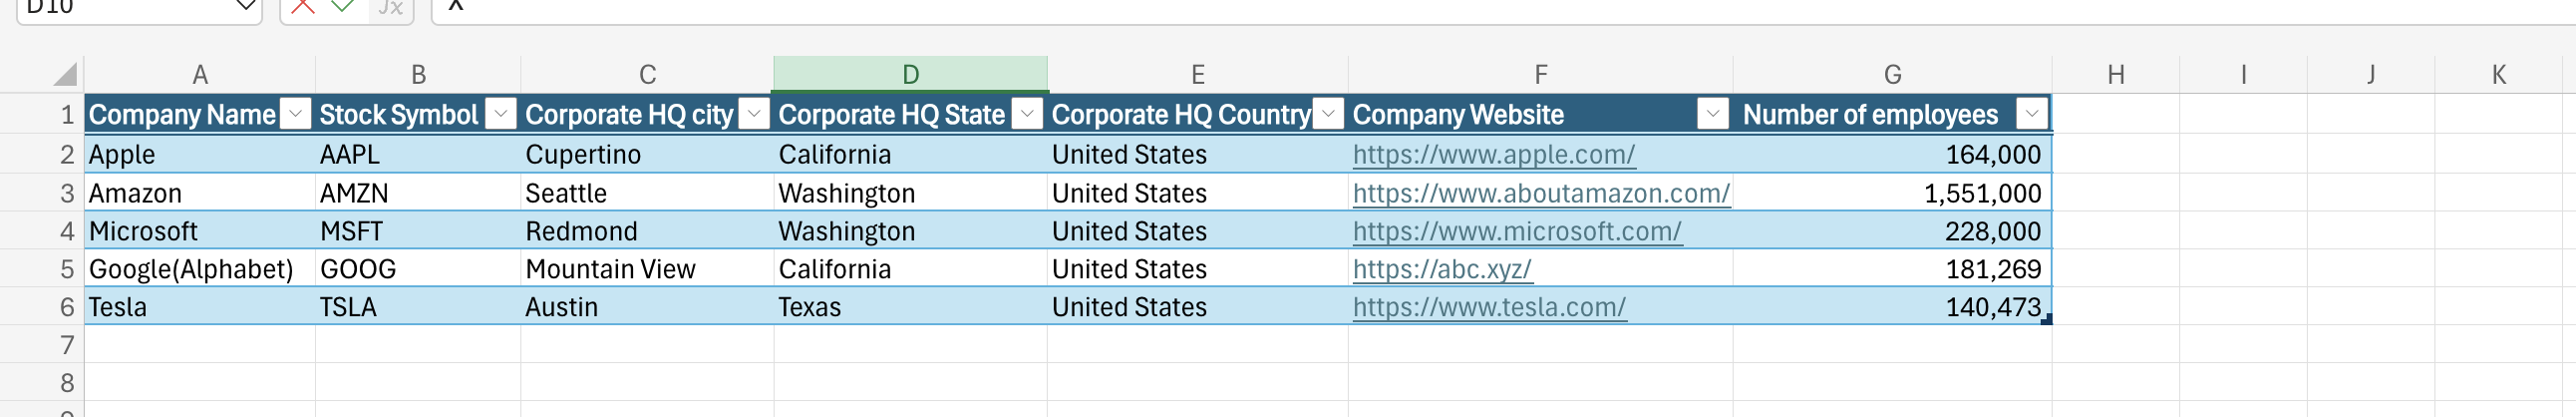
MGS 3040 MIS - Excel Assignment Instructions For this assignment each team is required to a fictitious stock portfolio by investing a total of $100,000 (paper money, of course! - not real money) in five companies in the Information Technology Industry, analyze the portfolio's performance using Excel, a chart to visualize the relative performance of the stocks in the portfolio and of the Dow Jones Industrial Average (DJIA) index. If you do not know what the DJIA is, please read about the index in Wikipedia or a financial news site. The assignment will be graded based on the completion of the required parts according to the instructions and not on the financial performance of the portfolio. You must design the Excel files so it is easy to read. Make sure all amounts are in a numeric format with two decimal places. Step 1 - an Excel file with the file name being your class, section and your team number (such as MGS3040Section05Team2Excel.xls). The file you submit must be in this format. In Microsoft Excel, each file is called a workbook. You are to submit one workbook with separate worksheets (tabs) as described below. You should upload the workbook to Google Docs (or OneDrive Live) and share it with your team members. Do NOT convert it to a Google document. Step 2 - Now, pick five technology companies like Apple, Oracle, SAP, etc. These stocks will represent your portfolio which you will track for a period of the past six consecutive months (not including the current month since we don't have the closing numbers yet - so if the current month is February use the previous August to January months for example). Step 3 - a worksheet (tab) in the Excel workbook that is labeled Companies. On this tab, include the stock symbol of your five companies along with the company name, corporate headquarters city, state, and country, company Web site, and number of employees. Make sure that city, state and country are three separate columns. This information can be located in the Company Profile section of the Yahoo! Finance Web site (http://finance.yahoo.com). You may use other sites if you are familiar with the sites. Step 4 - Obtain the stock prices of your selected companies for any prior six consecutive months. For each month, retrieve the open, high, low, close prices and volumes, for each of your selected stocks. You may retrieve this information from the Yahoo! Finance page by entering the stock symbol and selecting "Historical Prices". Put all the monthly data in a worksheet of your spreadsheet and enter the name Monthly Data in the index tab. The format of this worksheet should be 6 columns with headings for ticker, date, open, high, low and volume. Turn this data into a table.
Step 5 - your own (hypothetical) portfolio by distributing $100,000 across your five selected companies. Figure out the number of shares you want to buy from each company. One way to do this is to decide the amount to invest, and then divide it by the stock price. Do not buy fractions of shares. You may allocate different amounts of money to each stock, but you must invest money in each of the five companies, and you must invest about $100,000 without going over. You will hold the stocks for 6 months and then sell them. You will invest in your portfolio by "purchasing" the shares at the opening prices on the first month and liquidate it by "selling" all the shares on the last month at the closing prices. Ignore the commission that you would have to pay, had these been real transactions. For example, in July buy at the opening prices and in December sell at closing prices.
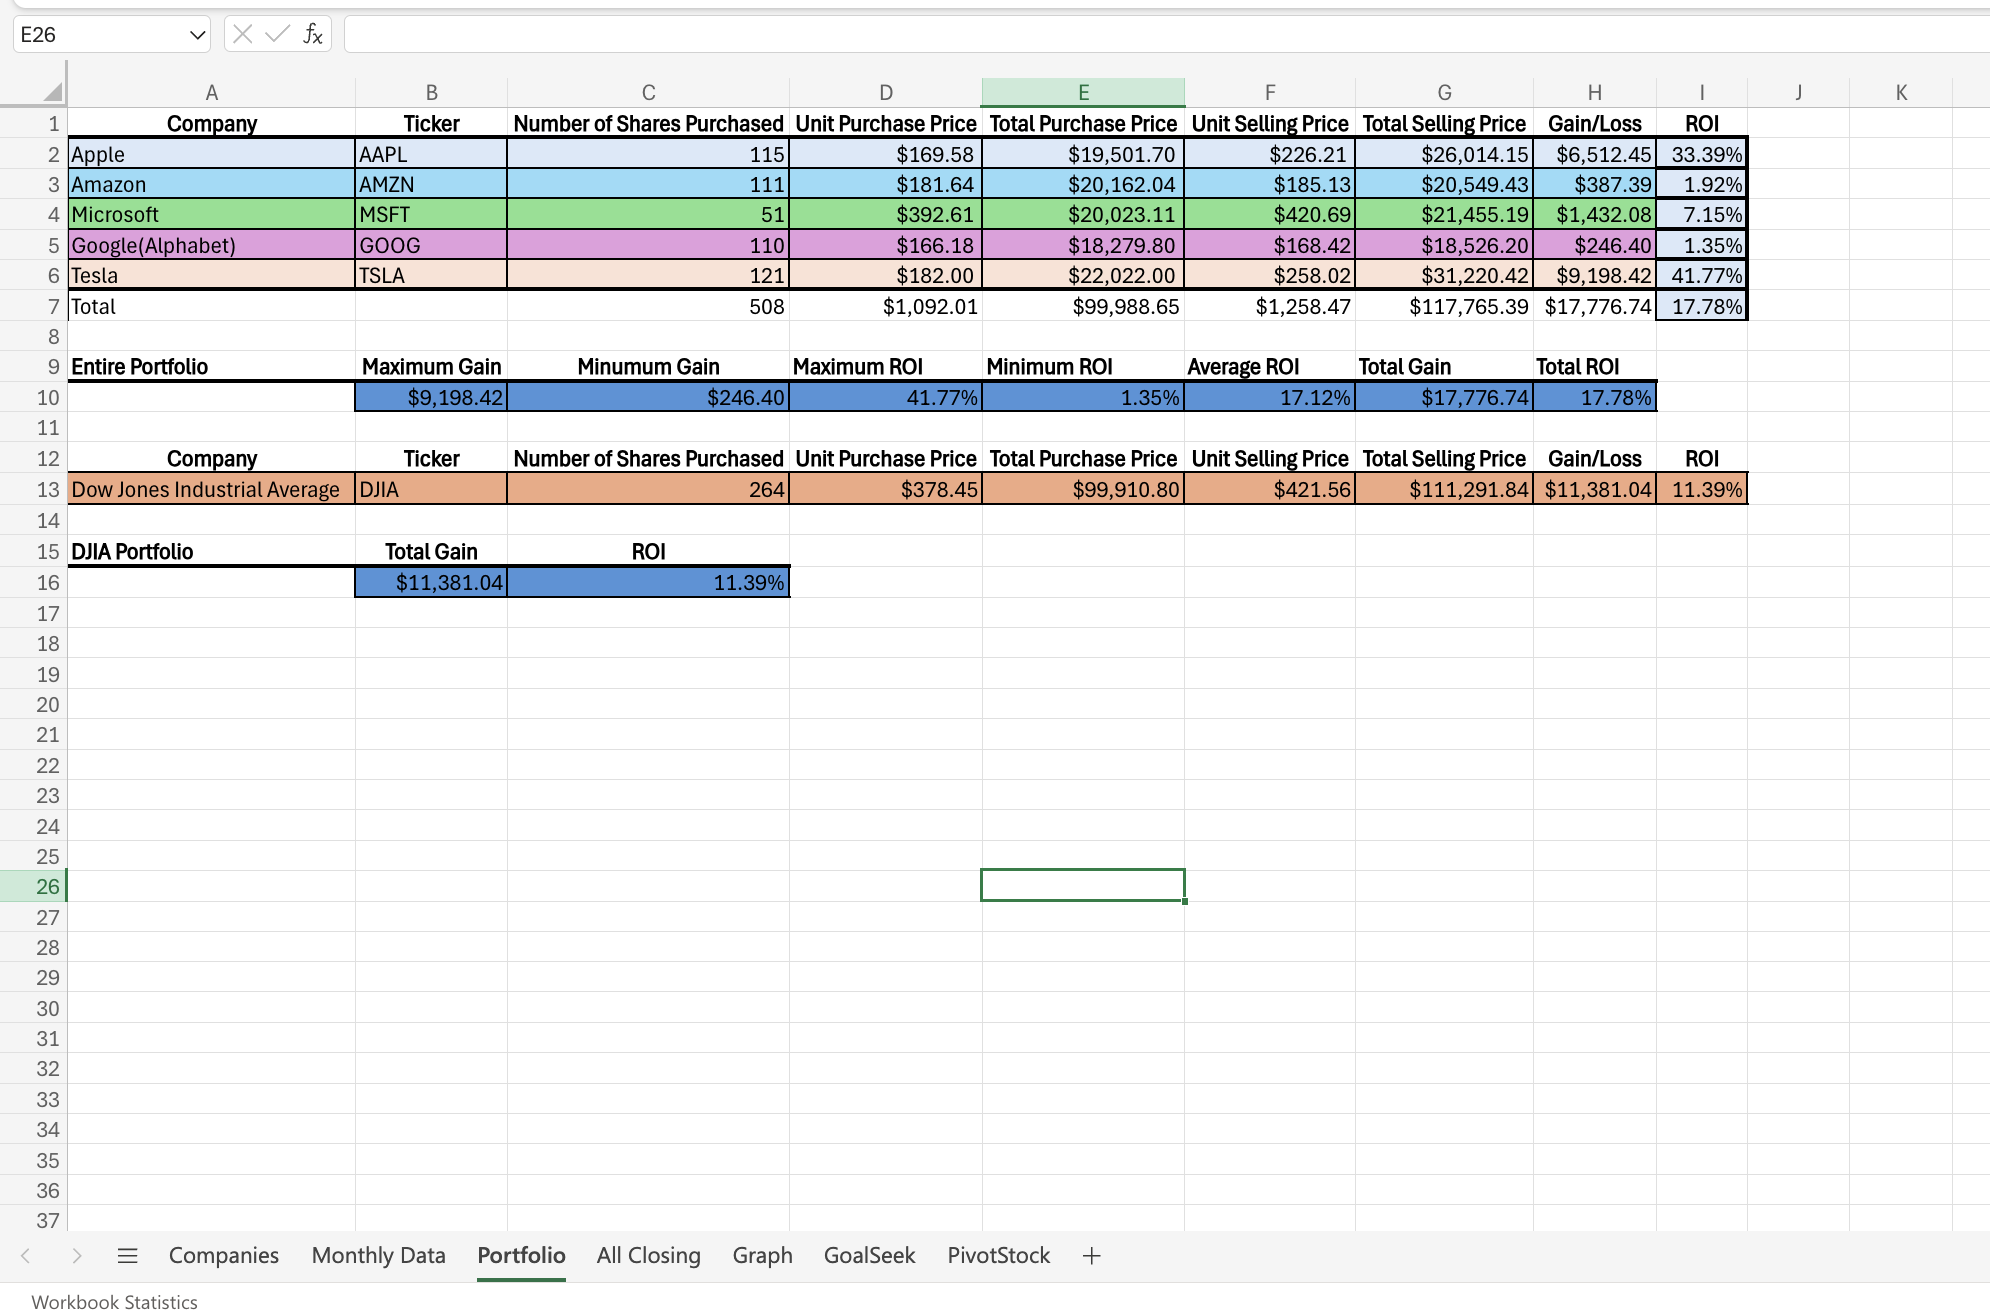
In another worksheet of your Excel workbook, design a spreadsheet to enter the information and analyze the performance of your portfolio. Give it the name of Portfolio. Information about both each company and the entire portfolio should be included on this worksheet. 1. For each company: a. Display the number of shares purchased (do not enter the formula you used to calculate the number of shares, enter the actual number of shares purchased), the unit purchase price and the unit selling price. b. Develop and enter the appropriate formulas to calculate for each company: the total purchase price, the gain (loss) and Return on Investment (ROI). The ROI formula is: (sale price - buy price) / (buy price). Label the columns appropriately. Use percent format with 2 decimals for the ROI. 2. For the entire portfolio: a. Among the 5 stocks, enter the appropriate Excel formulas to calculate the Maximum Gain (or minimum loss), Minimum Gain (or maximum loss), Maximum ROI, and Minimum ROI (See the functions MAX and MIN) b. Enter Excel Formulas to calculate Average ROI, Total Gain(Loss), and ROI of the entire portfolio. (Hint: To compute the ROI on the entire portfolio, use the total profit (loss) on the portfolio divided by the total amount invested.)
Put meaningful labels in the cells and format the spreadsheet appropriately. Step 6 - Invest (about - as close as you can without going over) $100,000 in the Dow Jones Industrial Average (DJIA). In order to do that, assume you can "buy" the index at a price equal to its value divided by 100 (e.g. if the index is 23,700, then the price is $237.00). You will buy the index at its value at the opening of the market the first trading day, and sell it at its value at the end of the last trading day.
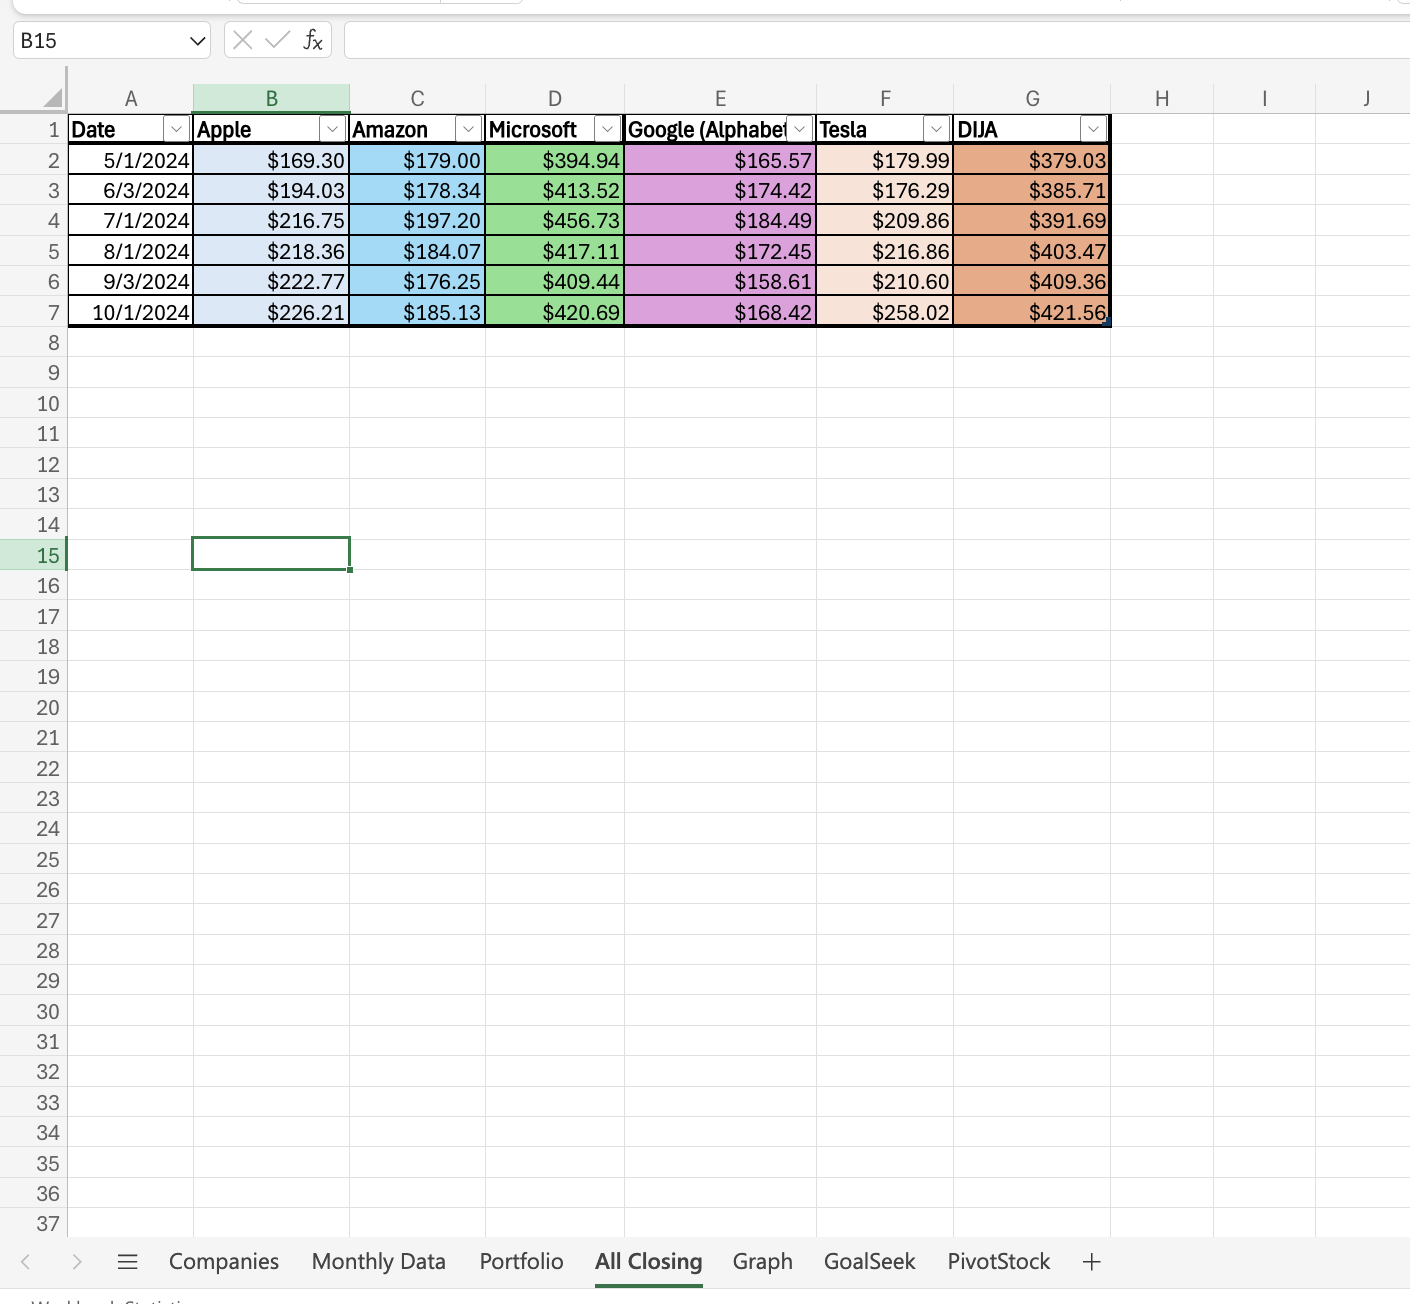
Using the bottom part of the Portfolio spreadsheet you have already designed, display the number of units of the DJIA purchased, the opening price, the closing price, the total purchase price, and compute your profit (loss) and the ROI. Step 7 - a graph to visualize the trading data of the 5 stocks and the DJIA. In a new worksheet, named All Closing, organize the monthly closing prices of the 5 stocks in your portfolio, for the time you held the stocks. Also copy the closing value of the index divided by 100 to get the "price" of the index for the same time period. The top of the worksheet should look like the following example:
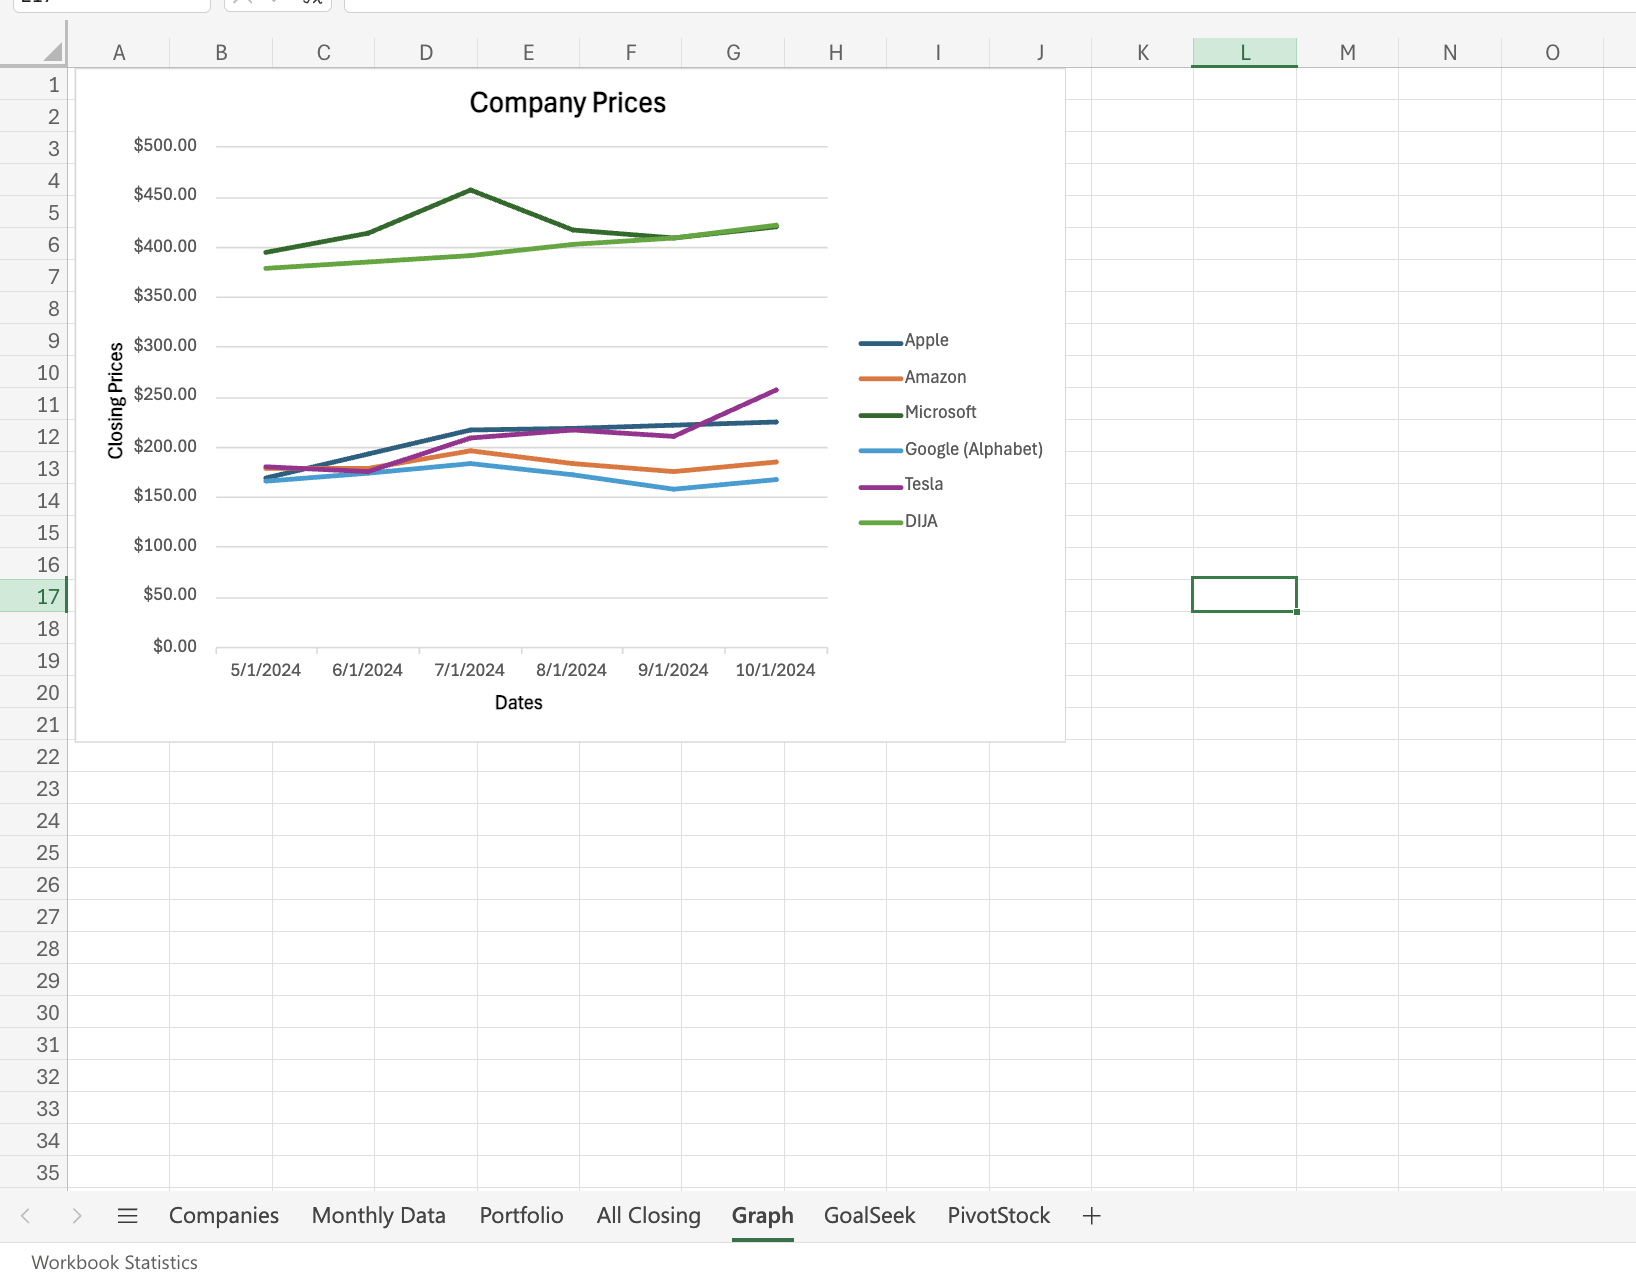
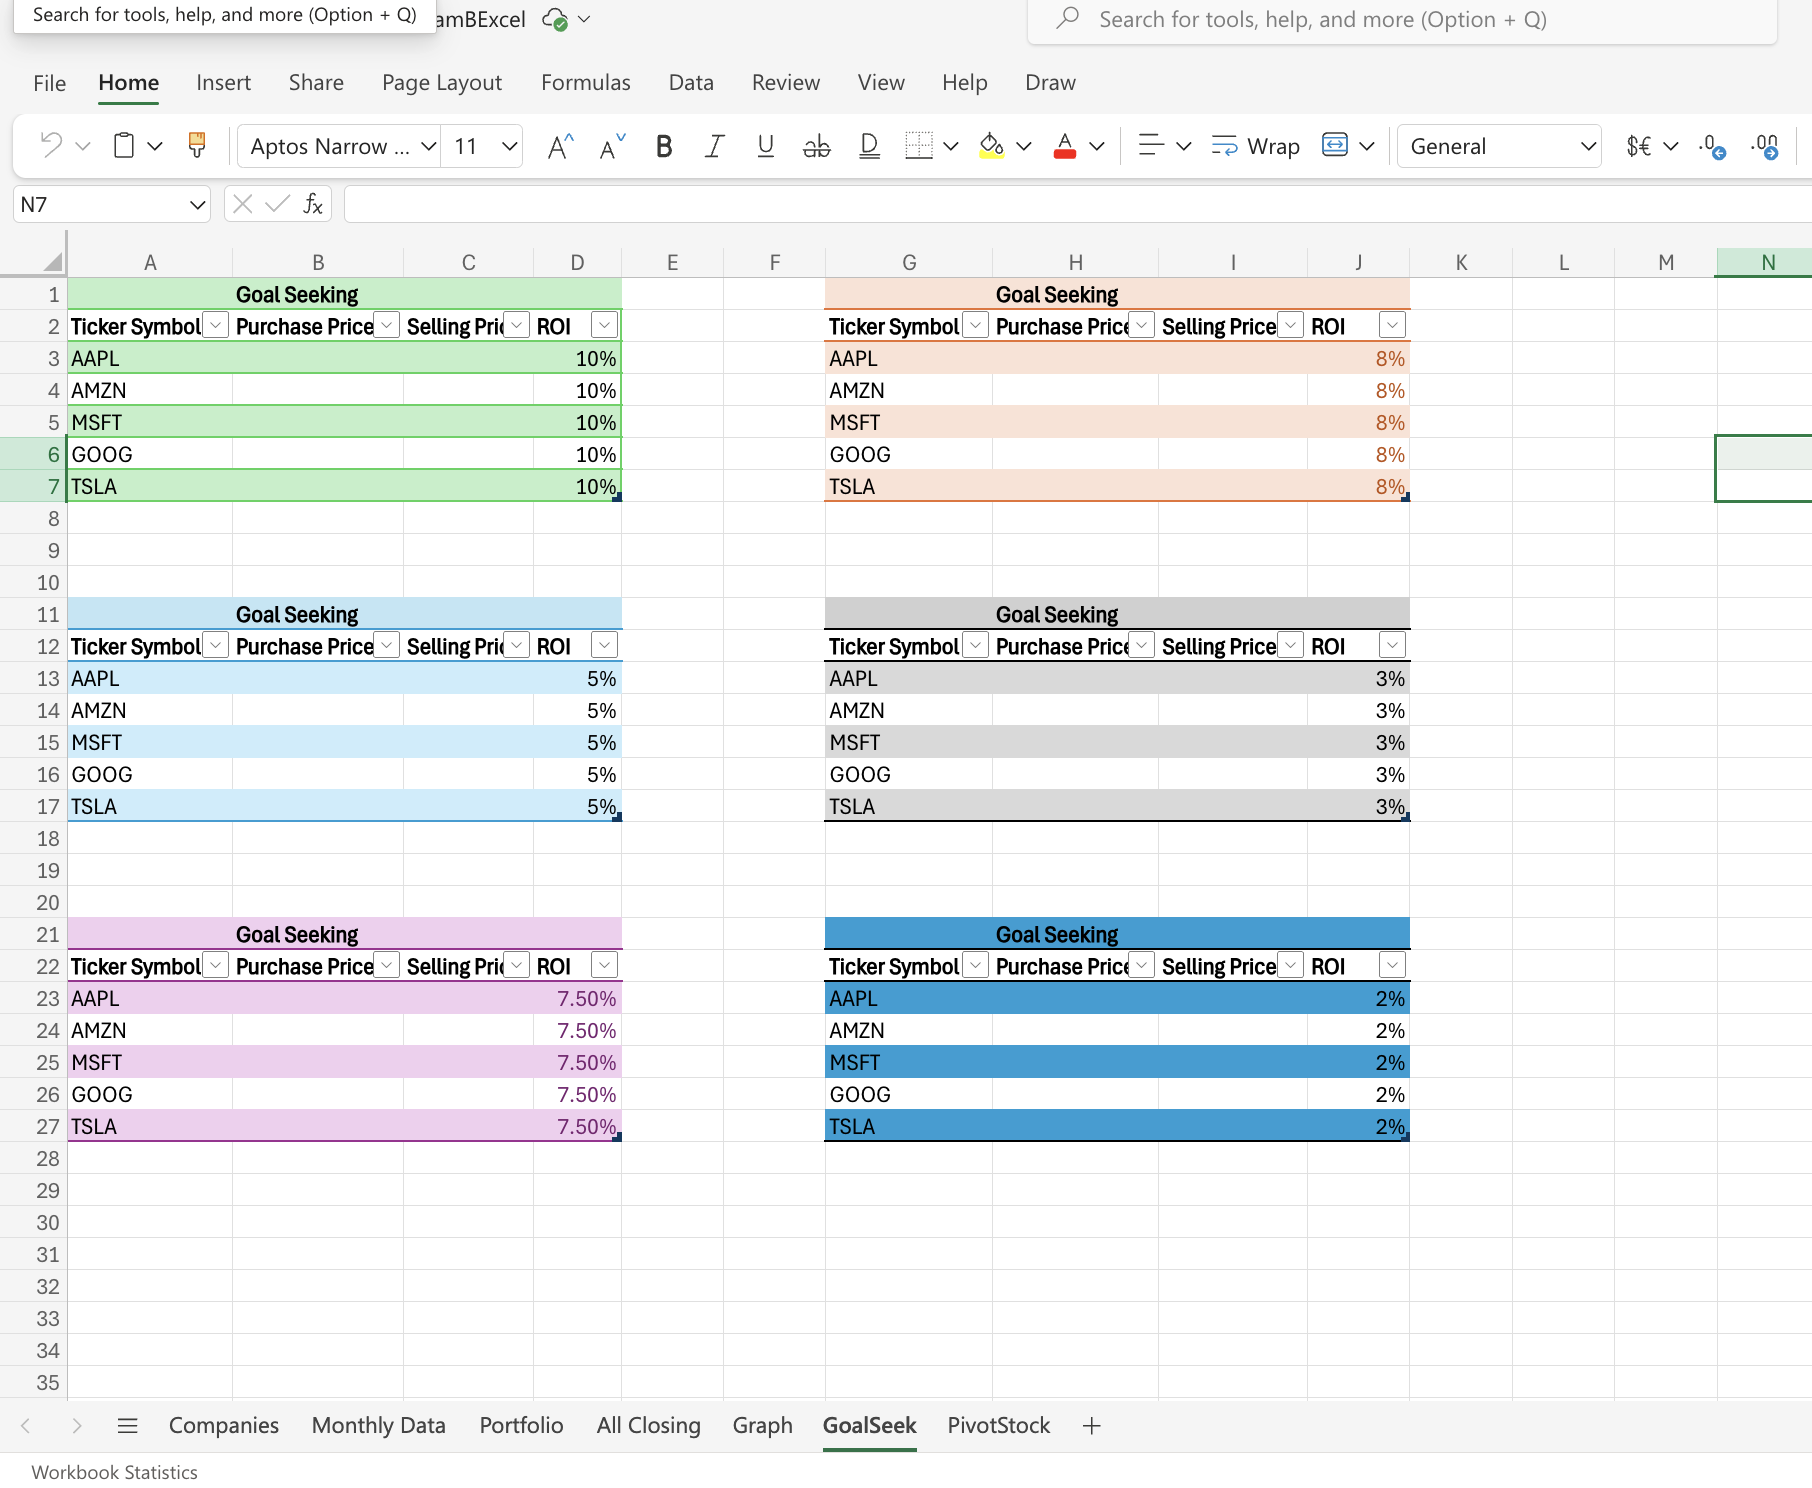
Then, a line graph with all six closing prices and the index, each one being represented by a line of different color. Make sure the graph has a title, the appropriate legends, and is properly formatted. The graph should be in a separate worksheet named Graph. Step 8 - Based on the formulas for ROI and the purchase price for each stock and the Dow (taken from the Portfolio worksheet), set up a new worksheet called GoalSeek with 4 columns. The first should be the Ticker symbol, the second the purchase price, the third the selling price and the fourth the ROI. Using goal seeking, determine the selling price for each stock if you wanted an ROI of 10, 8, 5, 3, 7.5 and 2% respectively for your stocks. DO NOT simply calculate the selling price using a formula. If you do not know what goal seeking is, please refer to the tutorials in Blackboard or speak to me. The goal seek worksheet could look something like this:
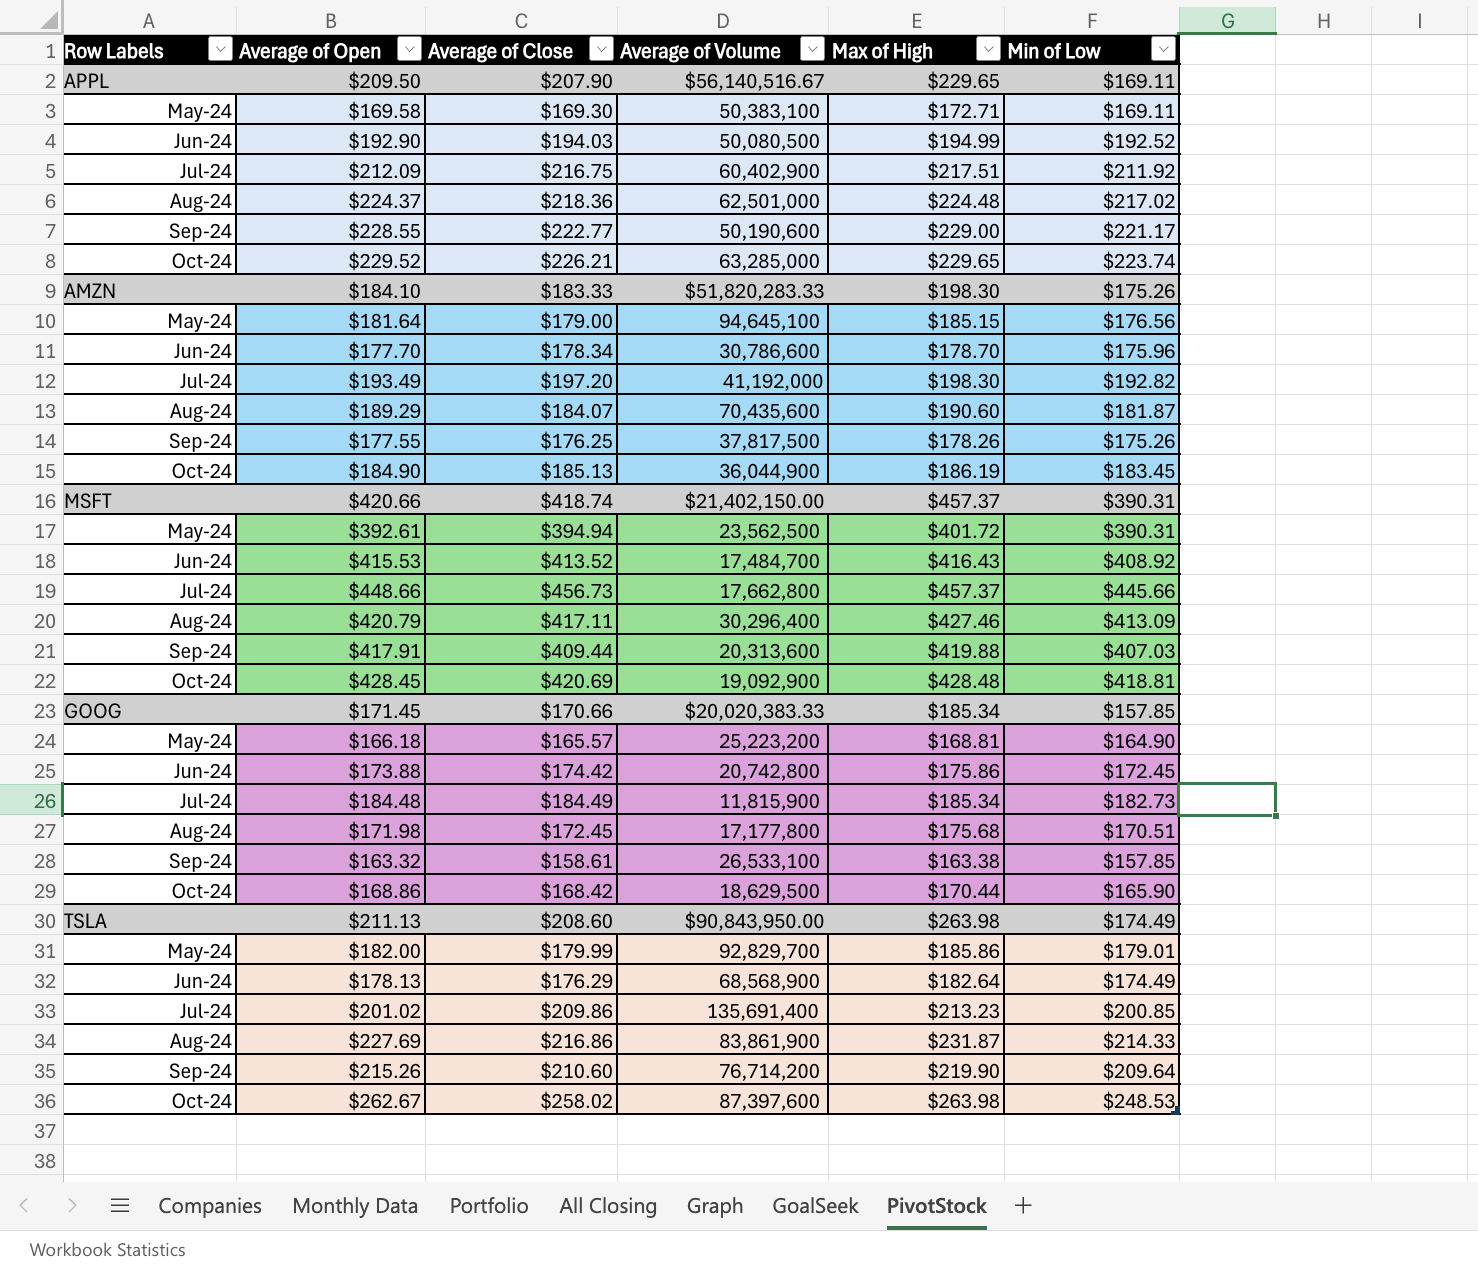
Step 9 - Based on the worksheet called Monthly Data, a pivot table in a separate worksheet called PivotStock. Organize the pivot table by company and then by date. Summarize the average open, close and volumes, the maximum of high prices and the minimum of low prices. The pivot table should look something like this:
Submit for grading 1. Share your Excel file with tabs labeled Company, Monthly Data, Portfolio, All Closing, Graph, GoalSeek and PivotStock with me on Google Drive (or One Drive). 2. Also one member of each team must submit the Excel file (or Google Sheets link after giving me permission to edit it) through Canvas with a comment that the team has completed the assignment. NOTE: THIS ASSIGNMENT IS DUE ON THE DATE PROVIDED BY THE INSTRUCTOR. LATE ASSIGNMENTS WILL LOSE 10 POINTS FOR EACH LATE DAY.
bellow is the process that i have made i need help with question 8 and 9
in excel; please
Step by Step Solution
There are 3 Steps involved in it

Get step-by-step solutions from verified subject matter experts