

Question: MGT 364 - Operations Management Case #4 - Statistical Process Control Background: Green River Chemical Company Case Green River Chemical Company customers have complained regarding
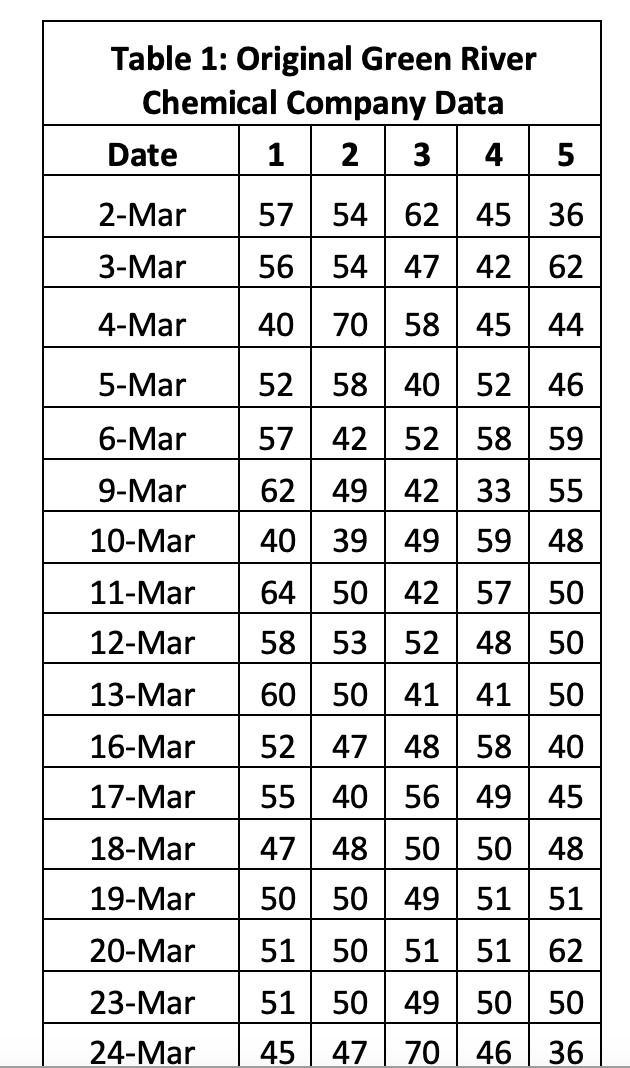
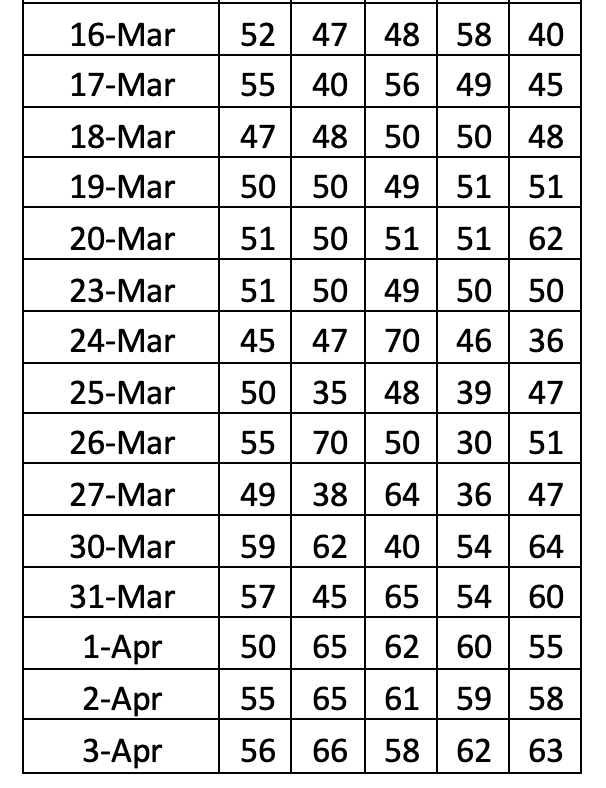
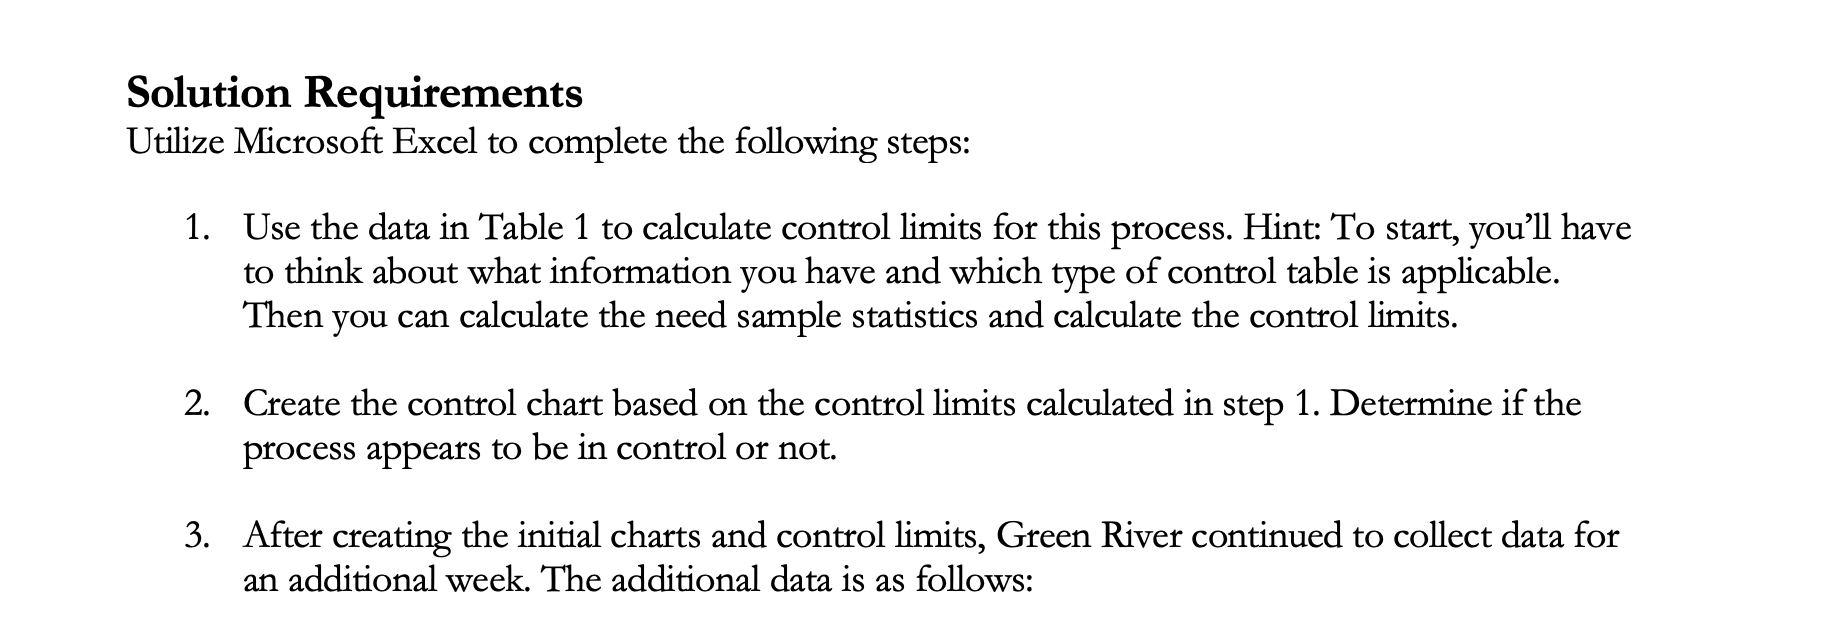
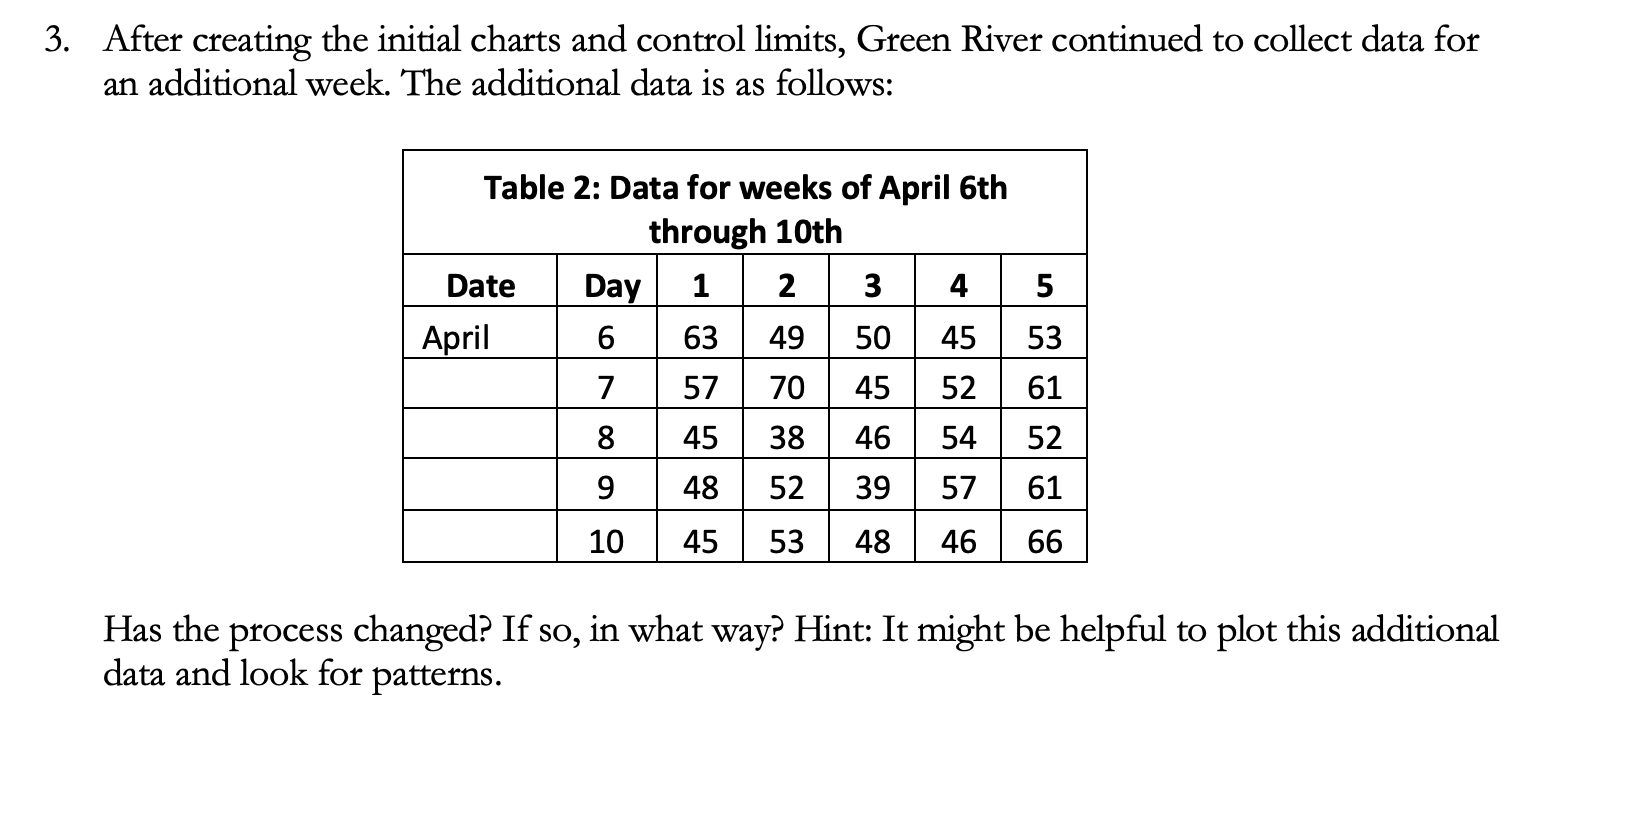
MGT 364 - Operations Management Case \#4 - Statistical Process Control Background: Green River Chemical Company Case Green River Chemical Company customers have complained regarding the sulfate content of the company's product. Every customer allows some sulfate content, but theoretically there should be none. The usual customer specification is 90 parts per million (PPM) sulfate. The quality control department at Green River feels that there is no problem with sulfate content, which has been averaging just over 50 PPM. The production department estimates that a substantial investment would be required to lower the amount of this contaminant. These two departments, after consulting with the marketing department and customers, suggest that a control chart be set up to monitor sulfate content. Five samples will be tested per day and plotted as one point on the chart. The samples were collected over a period of 5 weeks from March 2nd through April 3rd. The data collected is as follows: Table 1: Original Green River Chemical Company Data \begin{tabular}{|c|c|c|c|c|c|} \hline Date & 1 & 2 & 3 & 4 & 5 \\ \hline 2-Mar & 57 & 54 & 62 & 45 & 36 \\ \hline 3-Mar & 56 & 54 & 47 & 42 & 62 \\ \hline 4-Mar & 40 & 70 & 58 & 45 & 44 \\ \hline 5-Mar & 52 & 58 & 40 & 52 & 46 \\ \hline 6-Mar & 57 & 42 & 52 & 58 & 59 \\ \hline 9-Mar & 62 & 49 & 42 & 33 & 55 \\ \hline 10-Mar & 40 & 39 & 49 & 59 & 48 \\ \hline 11-Mar & 64 & 50 & 42 & 57 & 50 \\ \hline 12-Mar & 58 & 53 & 52 & 48 & 50 \\ \hline 13-Mar & 60 & 50 & 41 & 41 & 50 \\ \hline 16-Mar & 52 & 47 & 48 & 58 & 40 \\ \hline 17-Mar & 55 & 40 & 56 & 49 & 45 \\ \hline 18-Mar & 47 & 48 & 50 & 50 & 48 \\ \hline 19-Mar & 50 & 50 & 49 & 51 & 51 \\ \hline 20-Mar & 51 & 50 & 51 & 51 & 62 \\ \hline 23-Mar & 51 & 50 & 49 & 50 & 50 \\ \hline 24-Mar & 45 & 47 & 70 & 46 & 36 \\ \hline \end{tabular} \begin{tabular}{|l|l|l|l|l|l|} \hline 16-Mar & 52 & 47 & 48 & 58 & 40 \\ \hline 17-Mar & 55 & 40 & 56 & 49 & 45 \\ \hline 18-Mar & 47 & 48 & 50 & 50 & 48 \\ \hline 19-Mar & 50 & 50 & 49 & 51 & 51 \\ \hline 20-Mar & 51 & 50 & 51 & 51 & 62 \\ \hline 23-Mar & 51 & 50 & 49 & 50 & 50 \\ \hline 24-Mar & 45 & 47 & 70 & 46 & 36 \\ \hline 25-Mar & 50 & 35 & 48 & 39 & 47 \\ \hline 26-Mar & 55 & 70 & 50 & 30 & 51 \\ \hline 27-Mar & 49 & 38 & 64 & 36 & 47 \\ \hline 30-Mar & 59 & 62 & 40 & 54 & 64 \\ \hline 31-Mar & 57 & 45 & 65 & 54 & 60 \\ \hline 1-Apr & 50 & 65 & 62 & 60 & 55 \\ \hline 2-Apr & 55 & 65 & 61 & 59 & 58 \\ \hline 3-Apr & 56 & 66 & 58 & 62 & 63 \\ \hline \end{tabular} Solution Requirements Utilize Microsoft Excel to complete the following steps: 1. Use the data in Table 1 to calculate control limits for this process. Hint: To start, you'll have to think about what information you have and which type of control table is applicable. Then you can calculate the need sample statistics and calculate the control limits. 2. Create the control chart based on the control limits calculated in step 1. Determine if the process appears to be in control or not. 3. After creating the initial charts and control limits, Green River continued to collect data for an additional week. The additional data is as follows: After creating the initial charts and control limits, Green River continued to collect data for an additional week. The additional data is as follows: Has the process changed? If so, in what way? Hint: It might be helpful to plot this additional data and look for patterns
Step by Step Solution
There are 3 Steps involved in it

Get step-by-step solutions from verified subject matter experts