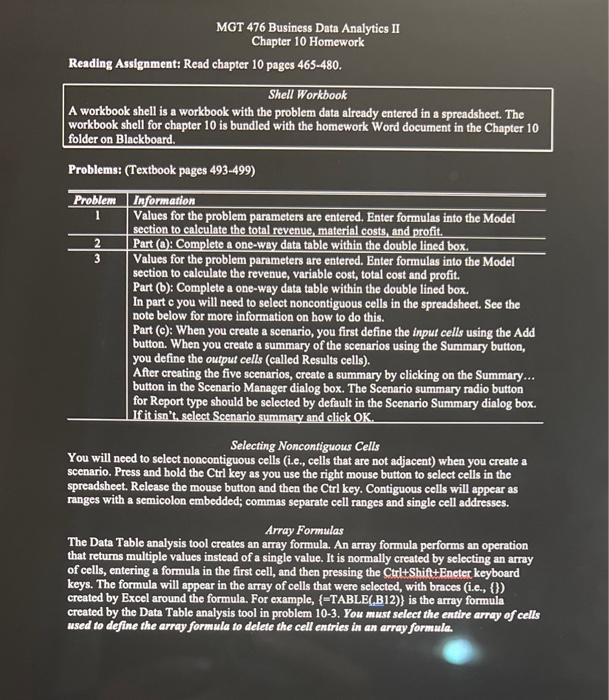
Question: MGT 476 Business Data Analytics II Chapter 10 Homework Reading Assignment: Read chapter 10 pages 465480. Shell Workbook A workbook shell is a workbook with

MGT 476 Business Data Analytics II Chapter 10
MGT 476 Business Data Analytics II Chapter 10 Homework Reading Assignment: Read chapter 10 pages 465480. Shell Workbook A workbook shell is a workbook with the problem data already entered in s spreadsheet. The workbook shell for chapter 10 is bundled with the homework Word document in the Chapter 10 folder on Blackboard. Problems: (Textbook pages 493-499) \begin{tabular}{c|l} \hline Problem & Information \\ \hline 1 & Values for the problem parameters are entered. Enter formulas into the Model section to calculate the total revenue, material costs, and profit. \\ \hline 2 & Part (a): Complete a one-way data table within the double lined box. \\ \hline 3 & Values for the problem parameters are entered. Enter formulas into the Model section to calculate the revenue, variable cost, total cost and profit. Part (b): Complete a one-way data table within the double lined box. In part c you will need to select noncontiguous cells in the spreadsheet. See the note below for more information on how to do this. Part (c): When you create a scenario, you first define the input cells using the Add button. When you create a summary of the scenarios using the Summary button, you define the output cells (called Results cells). After creating the five scenarios, create a summary by clicking on the Summary... button in the Scenario Manager dialog box. The Scenario summary radio button for Report type should be selected by default in the Scenario Summary dialog box. If it isn't. select Scenario summary and elick OK. \\ \hline \end{tabular} Selecting Noncontiguous Cells You will need to select noncontiguous cells (i.e., cells that are not adjacent) when you create a scenario. Press and hold the Ctrl key as you use the right mouse button to select cells in the spreadsheet. Release the mouse button and then the Ctrl key. Contiguous cells will appear as ranges with a semicolon embedded; commas separate cell ranges and single cell addresses. Array Formulas The Data Table analysis tool creates an array formula. An array formula performs an operation that returns multiple values instead of a single value. It is normally created by selecting an array of cells, entering a formula in the first cell, and then pressing the Ctrl+Shift+Eneter keyboard keys. The formula will appear in the array of cells that were selected, with braces (i.e., (\}) created by Excel around the formula. For example, {=TABLE(B12)} is the array formula created by the Data Table analysis tool in problem 10-3. You must select the entire array of cells used to define the array formula to delete the cell entries in an array formula. Problem 3: Part (a): What profitloss can be anticipated with a demand of 3,500 copies? Part (c): What access price per copy must the publisher charge to break even with a demand of 3,500 copies? Part (d): Which scenario yields the highest profit? Which scenario yields the lowest profit

Step by Step Solution

There are 3 Steps involved in it

1 Expert Approved Answer
Step: 1 Unlock blur-text-image
Question Has Been Solved by an Expert!

Get step-by-step solutions from verified subject matter experts

Step: 2 Unlock
Step: 3 Unlock

Students Have Also Explored These Related General Management Questions!