

Question: microeconomics uestion Completion Status: estion 2 1 points Save Ans Graph of TB & TC of Hours Working: The graph below measures salary (thousands per
microeconomics
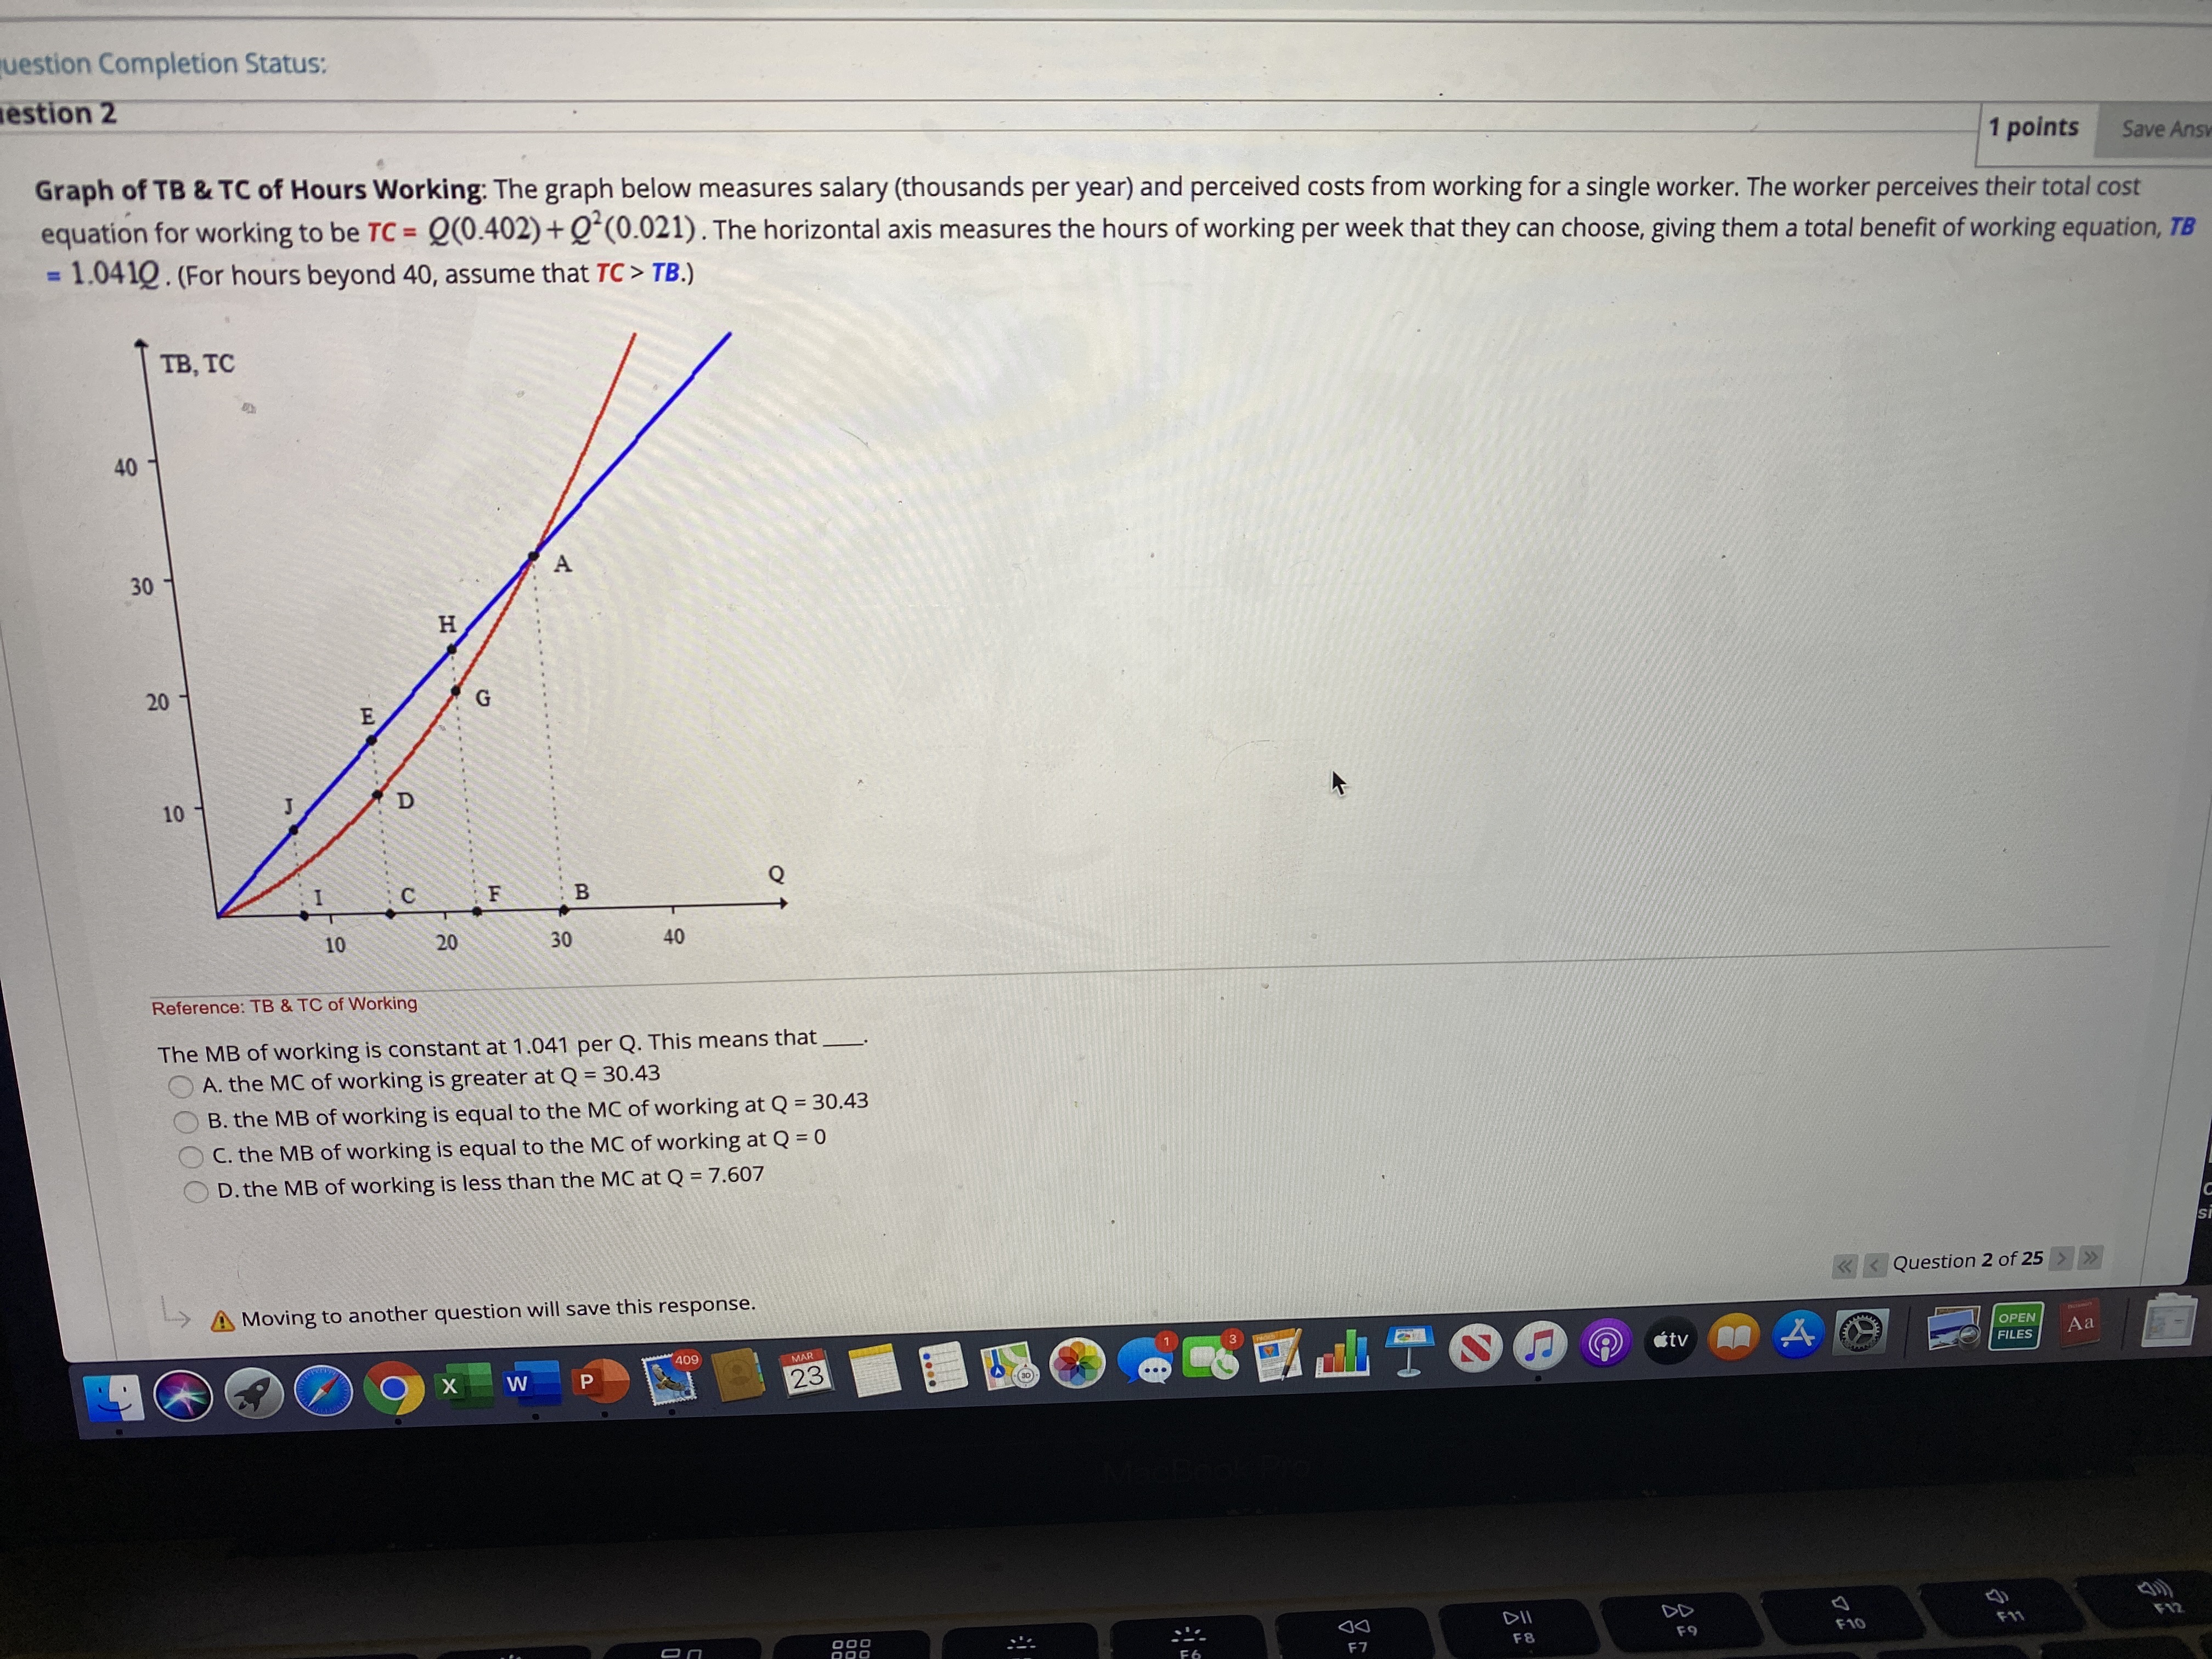
uestion Completion Status: estion 2 1 points Save Ans Graph of TB & TC of Hours Working: The graph below measures salary (thousands per year) and perceived costs from working for a single worker. The worker perceives their total cost equation for working to be TC = Q(0.402) + 0*(0.021) . The horizontal axis measures the hours of working per week that they can choose, giving them a total benefit of working equation, TB = 1.0410 . (For hours beyond 40, assume that TC > TB.) TB, TC 40 30 A 10 B 30 40 Reference: TB & TC of Working The MB of working is constant at 1.041 per Q. This means that_ A. the MC of working is greater at Q = 30.43 B. the MB of working is equal to the MC of working at Q = 30.43 C. the MB of working is equal to the MC of working at Q = 0 D. the MB of working is less than the MC at Q = 7.607 > A Moving to another question will save this response. >> X W P 23 tv QA 4 OPEN FILES Aa DII DD F12
Step by Step Solution
There are 3 Steps involved in it

Get step-by-step solutions from verified subject matter experts