

Question: Microsoft Excel Activity #2: Level Production Strategy X Question 1 0/10 Video Submit Excel Online Structured Activity: Level Production Su aleyy The ATV Corporation makes
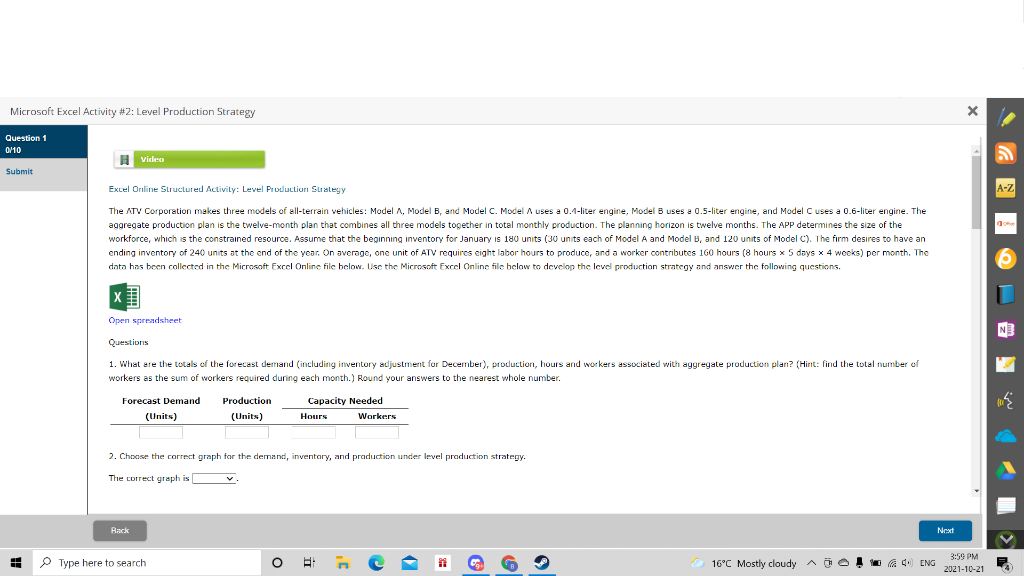
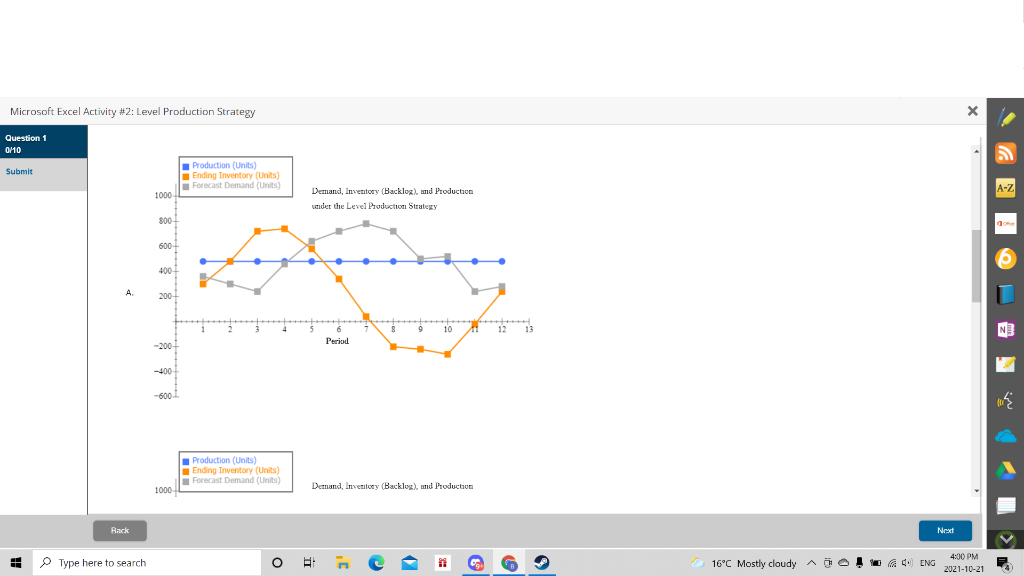
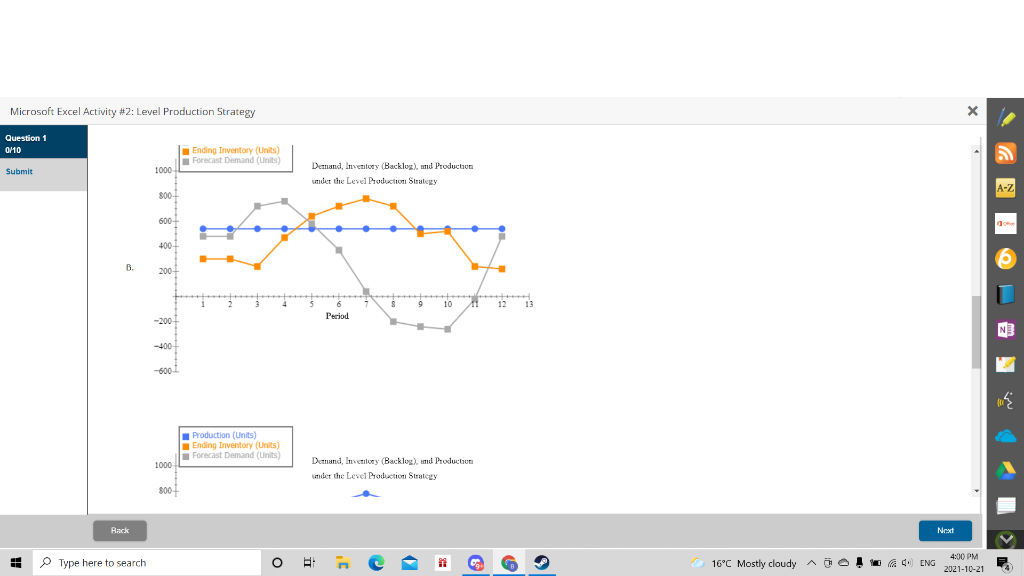

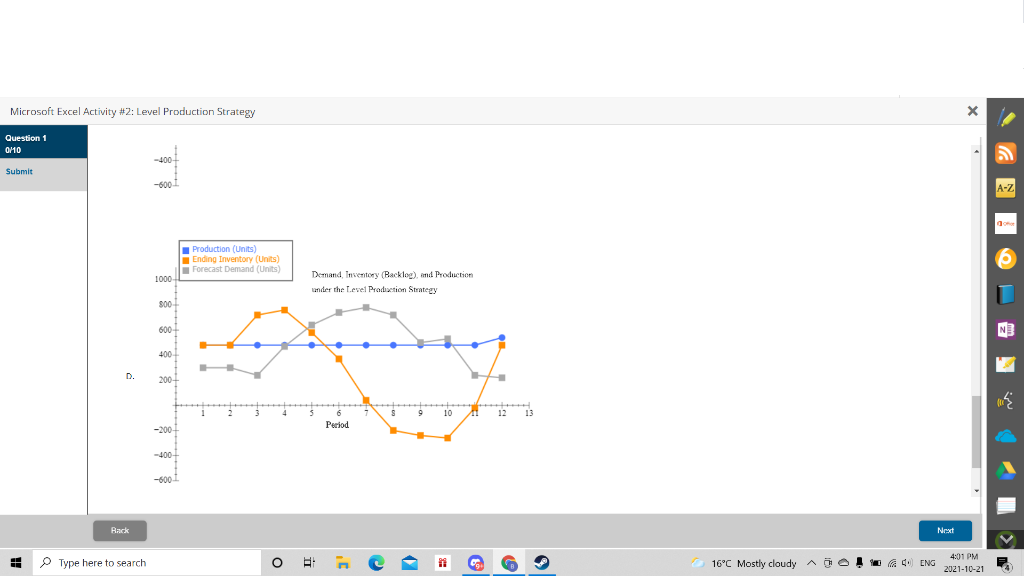
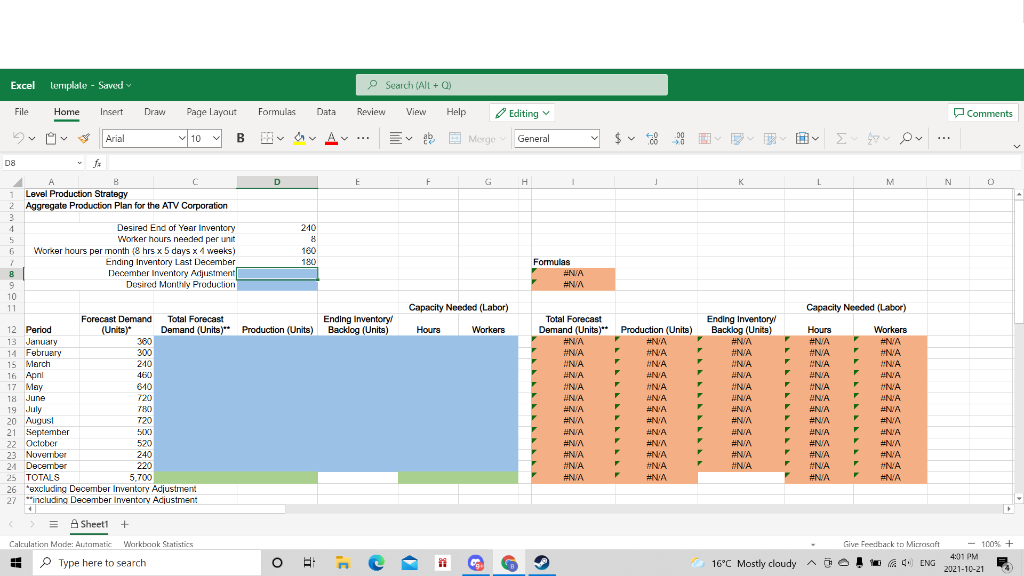
Microsoft Excel Activity #2: Level Production Strategy X Question 1 0/10 Video Submit Excel Online Structured Activity: Level Production Su aleyy The ATV Corporation makes three models of all-terrain vehicles: Model A. Model B, and Model C. Model A uses a 0.1-liter engine, Model B uses a 0.5-liter engine, and Model C uses a 0.6-liter engine. The aggregate production plan is the twelve-month plan that combines all three models together in total monthly production. The planning horizon is twelve months. The APP determines the size of the workforce, which is the constrained resource. Assume that the beginning inventory for January is 180 units (30 units each of Model A and Model B, and 120 units of Model C). The firm desires to have an ending inventory of 240 units at the end of the year. On average, one unit of ATV requires eight labor hours to produce, and a worker contributes 160 hours (8 hours x 5 days x 4 weeks) per month. The data has been collected in the Microsoft Excel Online file below. Use the Microsoft Excel Online file below to develop the level production strategy and answer the following questions, Open spreadsheet NE Questions 1. What are the totals of the forecast demand (including inventory adjustment for December), production, hours and workers associated with aggregate production plan? (Hint: find the total number of workers as the sum of workers required during each month.) Round your answers to the nearest whole number. Forecast Demand Production Capacity Needed (Units) (Units) Hours Workers 2. Choose the correct graph for the demand, inventory, and production under level production strategy. The correct graph is Rack Next 1 Type here to search 16C Mostly cloudy AOO! ENG 3:59 PM 2021-10-21 Microsoft Excel Activity #2: Level Production Strategy x Question 1 0/10 Submit Production (Units) Ending Inventory (Units) Forecast Demand (Units 1000 Demand, Inventory (Backlog), and Production under the Level Production Strategy 800 600 4001 A 2007 10 11213 Period -200 -400 -600 Production (Units) Ending Inventory (Units) Forecast Demand (Units) 1000 Deanand, Inventory (Backlog), and Production Back Next 1 Type here to search 16C Mostly cloudy AOO! ENG 4:00 PM 2021-10-21 Microsoft Excel Activity #2: Level Production Strategy X Question 1 0/10 Ending Inventory (Units) Forecast Demand (Units) Submit 1000 Demand, Inventory (Backlog) und Production under the Level Production Strategy 800 600 400 B. 200 9 10 12 13 -200 Period -400 -600 Production (Units) Ending Inventory (Units) Forecast Demand (Units) 1000 Demand, Inseticey (Backloge).md Production under the Level Production Strategy 800 Back Next Type here to search O 16C Mostly cloudy AOO! ENG 4:00 PM 2021-10-21 Microsoft Excel Activity #2: Level Production Strategy X Question 1 0/10 Production (Units) Ending Inventory (Units) Forecast Demand (Units) Submit 1000 Demand Inscritory (Backlog), mut Production under the Level Protection Strategy 800 600- 400 2001 10 11 13 Period -200 -400 -6001 Production (Units) Ending Inventory (Units) Forecast Demand (Units) 1000 Demand Inventory (Backlog), and Production under the Level Pradition Strategy Back Next 1 Type here to search O 16C Mostly cloudy AOO! ENG 4:01 PM 2021-10-21 Microsoft Excel Activity #2: Level Production Strategy X Question 1 0/10 -400 Submit -600 Production (Units) Ending Inventory (Units) Forecast Demand (Units) 1000 Demand Inventory (Backlog) and Production under the level Production Strategy 800 600 400 D. 200 10 12 13 Period -200 -400 -600 Rack Next 1 Type here to search O 16C Mostly cloudy AOO! ENG 4:01 PM 2021-10-21 Excel template - Saved Search (All + 0) File home Home Insert Draw Page Layout Formulas Data Review View Help Editing Comments Arial 10 B H V V abe General Merge V $ c 9% |- |- |- |- O E 4 Ov ... D8 E F G H 1 L M N 0 - Formulas #N/A #NA Capacity Needed (Labor) Capacity Needed (Labor) Ending Inventory Backlog (Units) Hours Workers B D 1 Level Production Strategy 2 Aggregate Production Plan for the ATV Corporation 3 4 Desired End of Year Inventory 240 5 Worker hours needed per unit 8 6 Worker hours per month (8 hrs x 5 days x 1 weeks) 180 Ending Inventory Last December 180 8 December Inventory Adjustment 9 Desired Monthly Production 10 11 Forecast Demand Total Forecast 12 Period (Units) Demand (Units)** Production (Units) 13 January 380 14 February 300 15 March 240 16 Apni 460 17 May 610 18 June 720 19 July 20 August 720 21 September 500 22 October 520 23 November 240 24 December 220 25 TOTALS 5,700 26 "excluding December Inventory Adjustment 27 "including December Inventory Adjustment F F F Total Forecast Ending Inventory Demand (Units)** Production (Units) Backlog (Units) #N/A #N/A #N/A #N/A #N/A #N/A UNA UNA WNA #N/A #NA ANA F #NA #N/A HINA UNA HNVA UNA F #N/A #N/A #NA #N/A #NA F *NA #NA #A #N/A #NA #NA #NA *NA #NA #NYA #N/A #N/A #N/A F #N'A #N/A #N/A F #N/A Hours #N/A #N/A UNA #N/A WNA ANA #N/A #N/A #N/A #NA #N/A #N/A #N/A F Workers #N/A N #N/A ANA #N/A NA ANA #NA #N/A #N/A N #NA #N/A #N/A #N/A F F F F = Sheet1 + Calculation Mode: Automatic Workbook Statistics Give Feedback to Microsoft - 100% + 4:01 PM 16C Mostly cloudy AGO!ENG 4. 2021-10-21 Type here to search o Microsoft Excel Activity #2: Level Production Strategy X Question 1 0/10 Video Submit Excel Online Structured Activity: Level Production Su aleyy The ATV Corporation makes three models of all-terrain vehicles: Model A. Model B, and Model C. Model A uses a 0.1-liter engine, Model B uses a 0.5-liter engine, and Model C uses a 0.6-liter engine. The aggregate production plan is the twelve-month plan that combines all three models together in total monthly production. The planning horizon is twelve months. The APP determines the size of the workforce, which is the constrained resource. Assume that the beginning inventory for January is 180 units (30 units each of Model A and Model B, and 120 units of Model C). The firm desires to have an ending inventory of 240 units at the end of the year. On average, one unit of ATV requires eight labor hours to produce, and a worker contributes 160 hours (8 hours x 5 days x 4 weeks) per month. The data has been collected in the Microsoft Excel Online file below. Use the Microsoft Excel Online file below to develop the level production strategy and answer the following questions, Open spreadsheet NE Questions 1. What are the totals of the forecast demand (including inventory adjustment for December), production, hours and workers associated with aggregate production plan? (Hint: find the total number of workers as the sum of workers required during each month.) Round your answers to the nearest whole number. Forecast Demand Production Capacity Needed (Units) (Units) Hours Workers 2. Choose the correct graph for the demand, inventory, and production under level production strategy. The correct graph is Rack Next 1 Type here to search 16C Mostly cloudy AOO! ENG 3:59 PM 2021-10-21 Microsoft Excel Activity #2: Level Production Strategy x Question 1 0/10 Submit Production (Units) Ending Inventory (Units) Forecast Demand (Units 1000 Demand, Inventory (Backlog), and Production under the Level Production Strategy 800 600 4001 A 2007 10 11213 Period -200 -400 -600 Production (Units) Ending Inventory (Units) Forecast Demand (Units) 1000 Deanand, Inventory (Backlog), and Production Back Next 1 Type here to search 16C Mostly cloudy AOO! ENG 4:00 PM 2021-10-21 Microsoft Excel Activity #2: Level Production Strategy X Question 1 0/10 Ending Inventory (Units) Forecast Demand (Units) Submit 1000 Demand, Inventory (Backlog) und Production under the Level Production Strategy 800 600 400 B. 200 9 10 12 13 -200 Period -400 -600 Production (Units) Ending Inventory (Units) Forecast Demand (Units) 1000 Demand, Inseticey (Backloge).md Production under the Level Production Strategy 800 Back Next Type here to search O 16C Mostly cloudy AOO! ENG 4:00 PM 2021-10-21 Microsoft Excel Activity #2: Level Production Strategy X Question 1 0/10 Production (Units) Ending Inventory (Units) Forecast Demand (Units) Submit 1000 Demand Inscritory (Backlog), mut Production under the Level Protection Strategy 800 600- 400 2001 10 11 13 Period -200 -400 -6001 Production (Units) Ending Inventory (Units) Forecast Demand (Units) 1000 Demand Inventory (Backlog), and Production under the Level Pradition Strategy Back Next 1 Type here to search O 16C Mostly cloudy AOO! ENG 4:01 PM 2021-10-21 Microsoft Excel Activity #2: Level Production Strategy X Question 1 0/10 -400 Submit -600 Production (Units) Ending Inventory (Units) Forecast Demand (Units) 1000 Demand Inventory (Backlog) and Production under the level Production Strategy 800 600 400 D. 200 10 12 13 Period -200 -400 -600 Rack Next 1 Type here to search O 16C Mostly cloudy AOO! ENG 4:01 PM 2021-10-21 Excel template - Saved Search (All + 0) File home Home Insert Draw Page Layout Formulas Data Review View Help Editing Comments Arial 10 B H V V abe General Merge V $ c 9% |- |- |- |- O E 4 Ov ... D8 E F G H 1 L M N 0 - Formulas #N/A #NA Capacity Needed (Labor) Capacity Needed (Labor) Ending Inventory Backlog (Units) Hours Workers B D 1 Level Production Strategy 2 Aggregate Production Plan for the ATV Corporation 3 4 Desired End of Year Inventory 240 5 Worker hours needed per unit 8 6 Worker hours per month (8 hrs x 5 days x 1 weeks) 180 Ending Inventory Last December 180 8 December Inventory Adjustment 9 Desired Monthly Production 10 11 Forecast Demand Total Forecast 12 Period (Units) Demand (Units)** Production (Units) 13 January 380 14 February 300 15 March 240 16 Apni 460 17 May 610 18 June 720 19 July 20 August 720 21 September 500 22 October 520 23 November 240 24 December 220 25 TOTALS 5,700 26 "excluding December Inventory Adjustment 27 "including December Inventory Adjustment F F F Total Forecast Ending Inventory Demand (Units)** Production (Units) Backlog (Units) #N/A #N/A #N/A #N/A #N/A #N/A UNA UNA WNA #N/A #NA ANA F #NA #N/A HINA UNA HNVA UNA F #N/A #N/A #NA #N/A #NA F *NA #NA #A #N/A #NA #NA #NA *NA #NA #NYA #N/A #N/A #N/A F #N'A #N/A #N/A F #N/A Hours #N/A #N/A UNA #N/A WNA ANA #N/A #N/A #N/A #NA #N/A #N/A #N/A F Workers #N/A N #N/A ANA #N/A NA ANA #NA #N/A #N/A N #NA #N/A #N/A #N/A F F F F = Sheet1 + Calculation Mode: Automatic Workbook Statistics Give Feedback to Microsoft - 100% + 4:01 PM 16C Mostly cloudy AGO!ENG 4. 2021-10-21 Type here to search o
Step by Step Solution
There are 3 Steps involved in it

Get step-by-step solutions from verified subject matter experts