

Question: Microsoft Excel R-Max Value Calculation and Graph Editing question to remove parts and focus on graphing Part 1: [Removed] - Given in X / Y
Microsoft Excel R-Max Value Calculation and Graph
Editing question to remove parts and focus on graphing
Part 1: [Removed] - Given in X / Y Table
Sample Set Data to use
x = Volume | y = drying rate
| x | y |
| 0 | 0 |
| 0.05 | 2.6 |
| 0.1 | 4.5 |
| 0.2 | 6.7 |
| 0.3 | 9.1 |
| 0.4 | 10.2 |
Part 2: [Removed]
Part 3: Determine an average and standard deviation for Rmax for each textile along with the linear flow rate of air through the textile.
Part 4: Recreate graph in figure 3.
Use a spreadsheet program for each of three trials.
[Removed section]
Calculate the drying rate (R), using formula: R = V l Drying Time
where: R = drying rate, in mL/h V = volume of water used in the test, in mL Drying Time = End time - Start Time, convert seconds to hours Example: R = 0.100 (mL)/0.022 (h) = 4.5 mL/h
Then Plot R,(mL/h) versus Vi (mL) (see Fig. 3) where i represents each volume challenge.
Need help re-creating this graph in excel with an explanation.
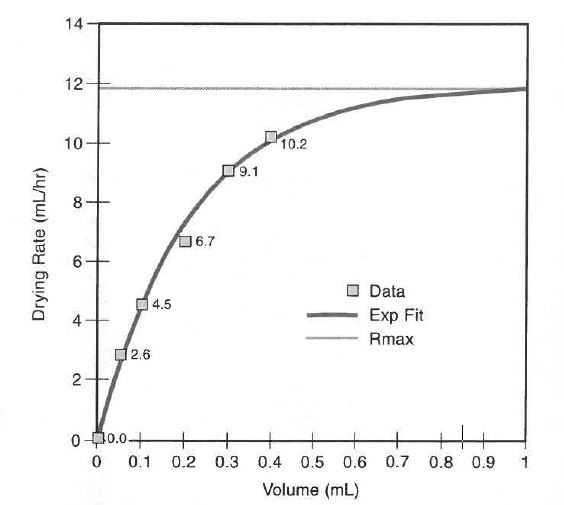
after that Fit the plot of R versus V to Equation 2 using a non-linear least squares fitting algorithm: R = a[ 1-exp( -bV)] where: R = Drying Rate, in mL/h V = volume of water used, in mL a and b = fitting constants
The fit yields constants a and h. The fit for Fig. 3 is a ~ 11.9 mL/h and b = 4.7 mL -1
The drying rate at the absorbent capacity (Rmax) is a. In Fig. 3 Rmax is 12 mL/h.
Sample Set Data to use
x = Volume | y = drying rate
| x | y |
| 0 | 0 |
| 0.05 | 2.6 |
| 0.1 | 4.5 |
| 0.2 | 6.7 |
| 0.3 | 9.1 |
| 0.4 | 10.2 |
14 12 10 10.2 9.1 6,7 Data 4.5 Exp Fit Rmax 2.6 0.0 0 0.1 0.2 0.3 0.4 0.5 0.6 0.7 0.8 0.9 Volume (mL)
Step by Step Solution
There are 3 Steps involved in it

Get step-by-step solutions from verified subject matter experts