

Question: Midterm Exam - Personal - Microsoft Edge X https://mylab.pearson.com/Student/PlayerTest.aspx?testld=241733846¢erwin=yes A Math 12 - 36080 Sum22 Jordan Walker | 07/01/22 11:59 AM E Test: Midterm Exam
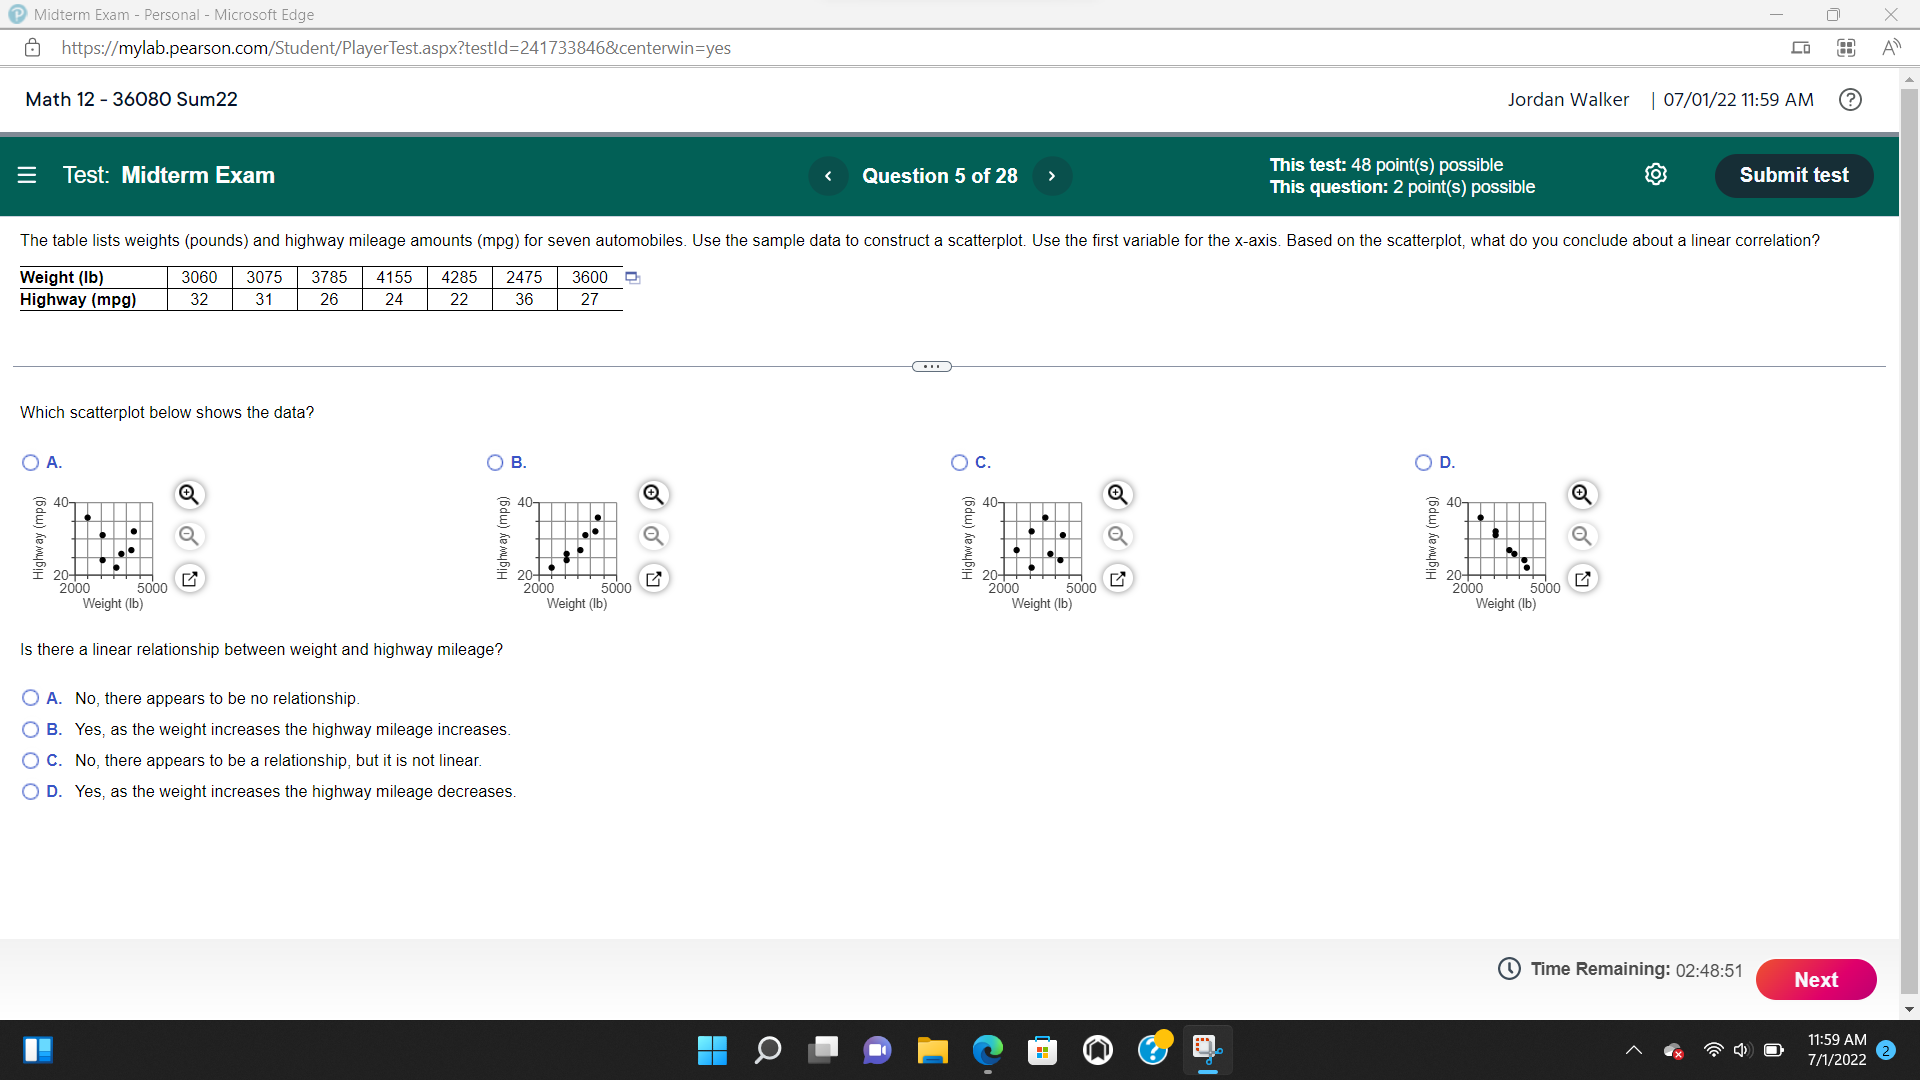
Midterm Exam - Personal - Microsoft Edge X https://mylab.pearson.com/Student/PlayerTest.aspx?testld=241733846¢erwin=yes A Math 12 - 36080 Sum22 Jordan Walker | 07/01/22 11:59 AM E Test: Midterm Exam Question 5 of 28 This test: 48 point(s) possible This question: 2 point(s) possible Submit test The table lists weights (pounds) and highway mileage amounts (mpg) for seven automobiles. Use the sample data to construct a scatterplot. Use the first variable for the x-axis. Based on the scatterplot, what do you conclude about a linear correlation? Weight (Ib) 3060 3075 3785 4155 4285 2475 3600 Highway (mpg) 32 31 26 24 22 36 27 Which scatterplot below shows the data? O A. O B. O C. O D. 40- 40- 40T 40T Highway (mpg) O Highway (mpg) Highway (mpg) Highway (mpg) 20-+ 20- 20- 20-+ + 2000 5000 2000 5000 2000 5000 2000 5000 Weight (Ib) Weight (lb) Weight (Ib) Weight (lb) Is there a linear relationship between weight and highway mileage? O A. No, there appears to be no relationship O B. Yes, as the weight increases the highway mileage increases. O C. No, there appears to be a relationship, but it is not linear O D. Yes, as the weight increases the highway mileage decreases. Time Remaining: 02:48:51 Next x 11:59 AM 7/1/2022 2
Step by Step Solution
There are 3 Steps involved in it

Get step-by-step solutions from verified subject matter experts