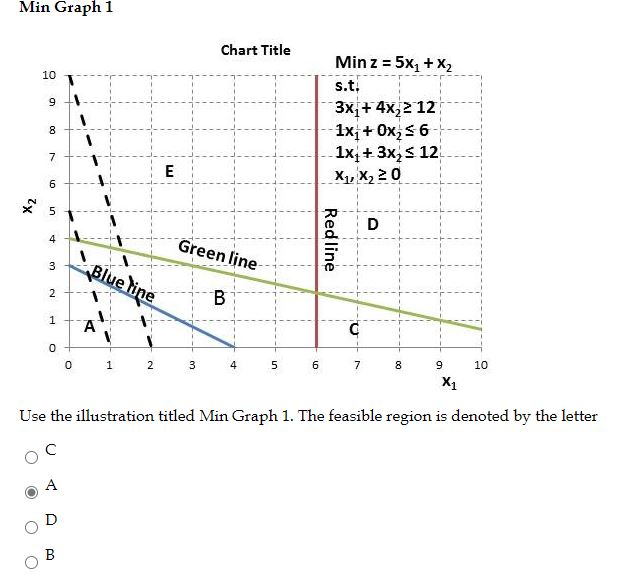
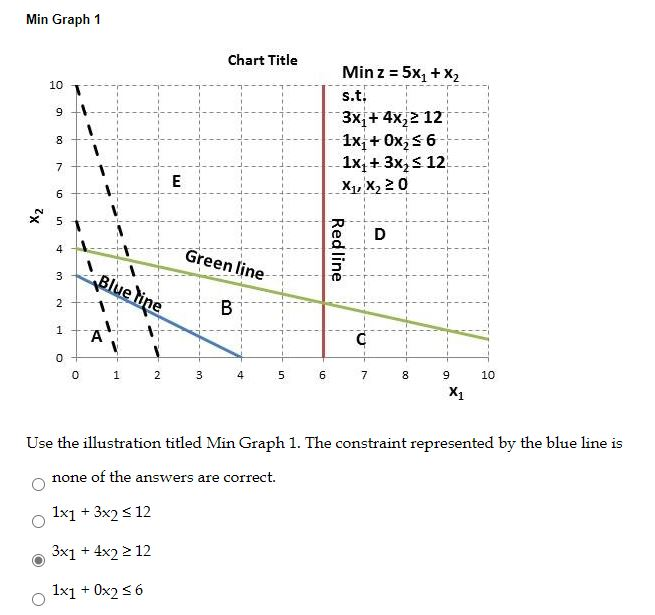
Question: Min Graph 1 Chart Title 10 9 Min z = 5x1 + x2 s.t. 3x + 4x 2 12 1x1 + 0x256 1x: + 3x

Min Graph 1 Chart Title 10 9 Min z = 5x1 + x2Min Graph 1 Chart Title 10 9 Min z = 5x1 + x2

Min Graph 1 Chart Title 10 9 Min z = 5x1 + x2 s.t. 3x + 4x 2 12 1x1 + 0x256 1x: + 3x s 12 X1, X, 20 00 7 E 6 5 X2 D 4 Green line Redline 3 Blue line N . 1 A C 0 0 1 2 3 4 5 6 7 8 10 9 X1 Use the illustration titled Min Graph 1. The feasible region is denoted by the letter A B Min Graph 1 Chart Title 10 9 Min z = 5x1 + x2 s.t. 3x + 4x 2 12 1x1 + Ox 56 1x + 3x s 12 8 1 7 E X1, X20 6 X2 5 D D 4 Green line 3 Blue line 2 B 1 0 0 1 2 3 4 5 6 7 8 10 9 X1 Use the illustration titled Min Graph 1. The constraint represented by the blue line is none of the answers are correct. 1x1 + 3x2 5 12 3x1 + x2 > 12 1x1 + 0x2 56

Step by Step Solution

There are 3 Steps involved in it

1 Expert Approved Answer
Step: 1 Unlock blur-text-image
Question Has Been Solved by an Expert!

Get step-by-step solutions from verified subject matter experts

Step: 2 Unlock
Step: 3 Unlock

Students Have Also Explored These Related General Management Questions!