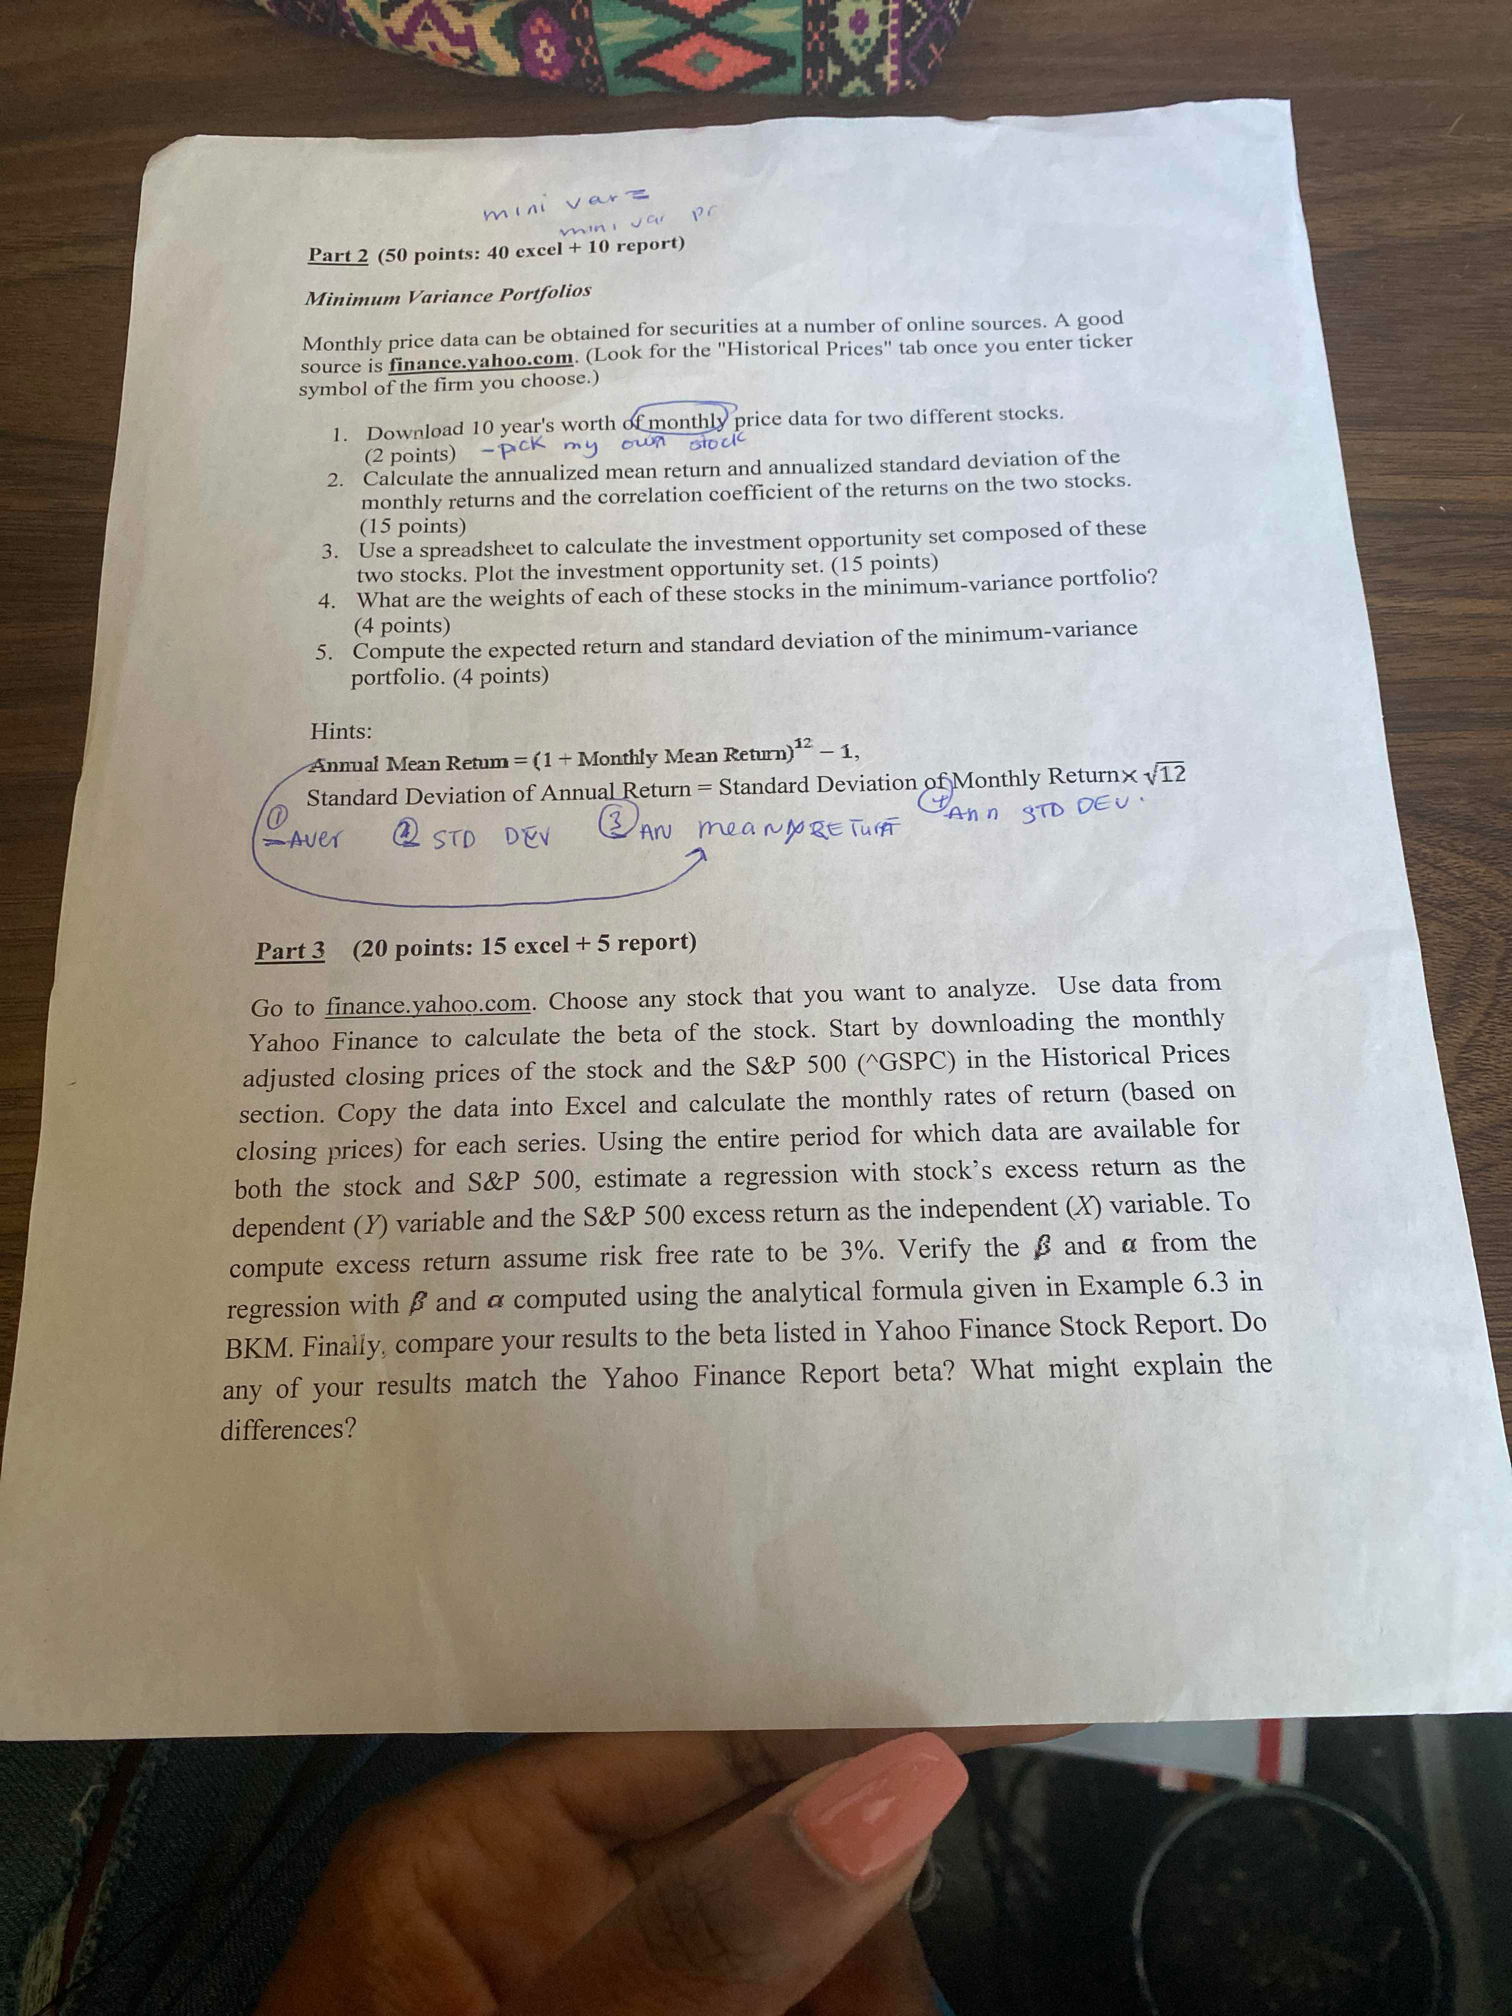
Question: mini var mini var pr Part 2 (50 points: 40 excel + 10 report) Minimum Variance Portfolios Monthly price data can be obtained for securities

mini var mini var pr Part 2 (50 points: 40 excel
mini var mini var pr Part 2 (50 points: 40 excel + 10 report) Minimum Variance Portfolios Monthly price data can be obtained for securities at a number of online sources. A good source is finance.yahoo.com. (Look for the "Historical Prices" tab once you enter ticker symbol of the firm you choose.) 1. Download 10 year's worth of monthly price data for two different stocks. (2 points) - pick my own stock 2. Calculate the annualized mean return and annualized standard deviation of the (15 points) monthly returns and the correlation coefficient of the returns on the two stocks. 3. Use a spreadsheet to calculate the investment opportunity set composed of these two stocks. Plot the investment opportunity set. (15 points) 4. What are the weights of each of these stocks in the minimum-variance portfolio? (4 points) 5. Compute the expected return and standard deviation of the minimum-variance portfolio. (4 points) Hints: Annual Mean Retum = (1 + Monthly Mean Return)12 - 1, Standard Deviation of Annual Return = Standard Deviation of Monthly Returnx v12 - Aver 2 STD DEV AN meanARE TurFT Ann STD DEV . Part 3 (20 points: 15 excel + 5 report) Go to finance. yahoo.com. Choose any stock that you want to analyze. Use data from Yahoo Finance to calculate the beta of the stock. Start by downloading the monthly adjusted closing prices of the stock and the S&P 500 (^GSPC) in the Historical Prices section. Copy the data into Excel and calculate the monthly rates of return (based on closing prices) for each series. Using the entire period for which data are available for both the stock and S&P 500, estimate a regression with stock's excess return as the dependent (Y) variable and the S&P 500 excess return as the independent (X) variable. To compute excess return assume risk free rate to be 3%. Verify the S and a from the regression with & and a computed using the analytical formula given in Example 6.3 in BKM. Finally, compare your results to the beta listed in Yahoo Finance Stock Report. Do any of your results match the Yahoo Finance Report beta? What might explain the differences

Step by Step Solution

There are 3 Steps involved in it

1 Expert Approved Answer
Step: 1 Unlock blur-text-image
Question Has Been Solved by an Expert!

Get step-by-step solutions from verified subject matter experts

Step: 2 Unlock
Step: 3 Unlock

Students Have Also Explored These Related Finance Questions!