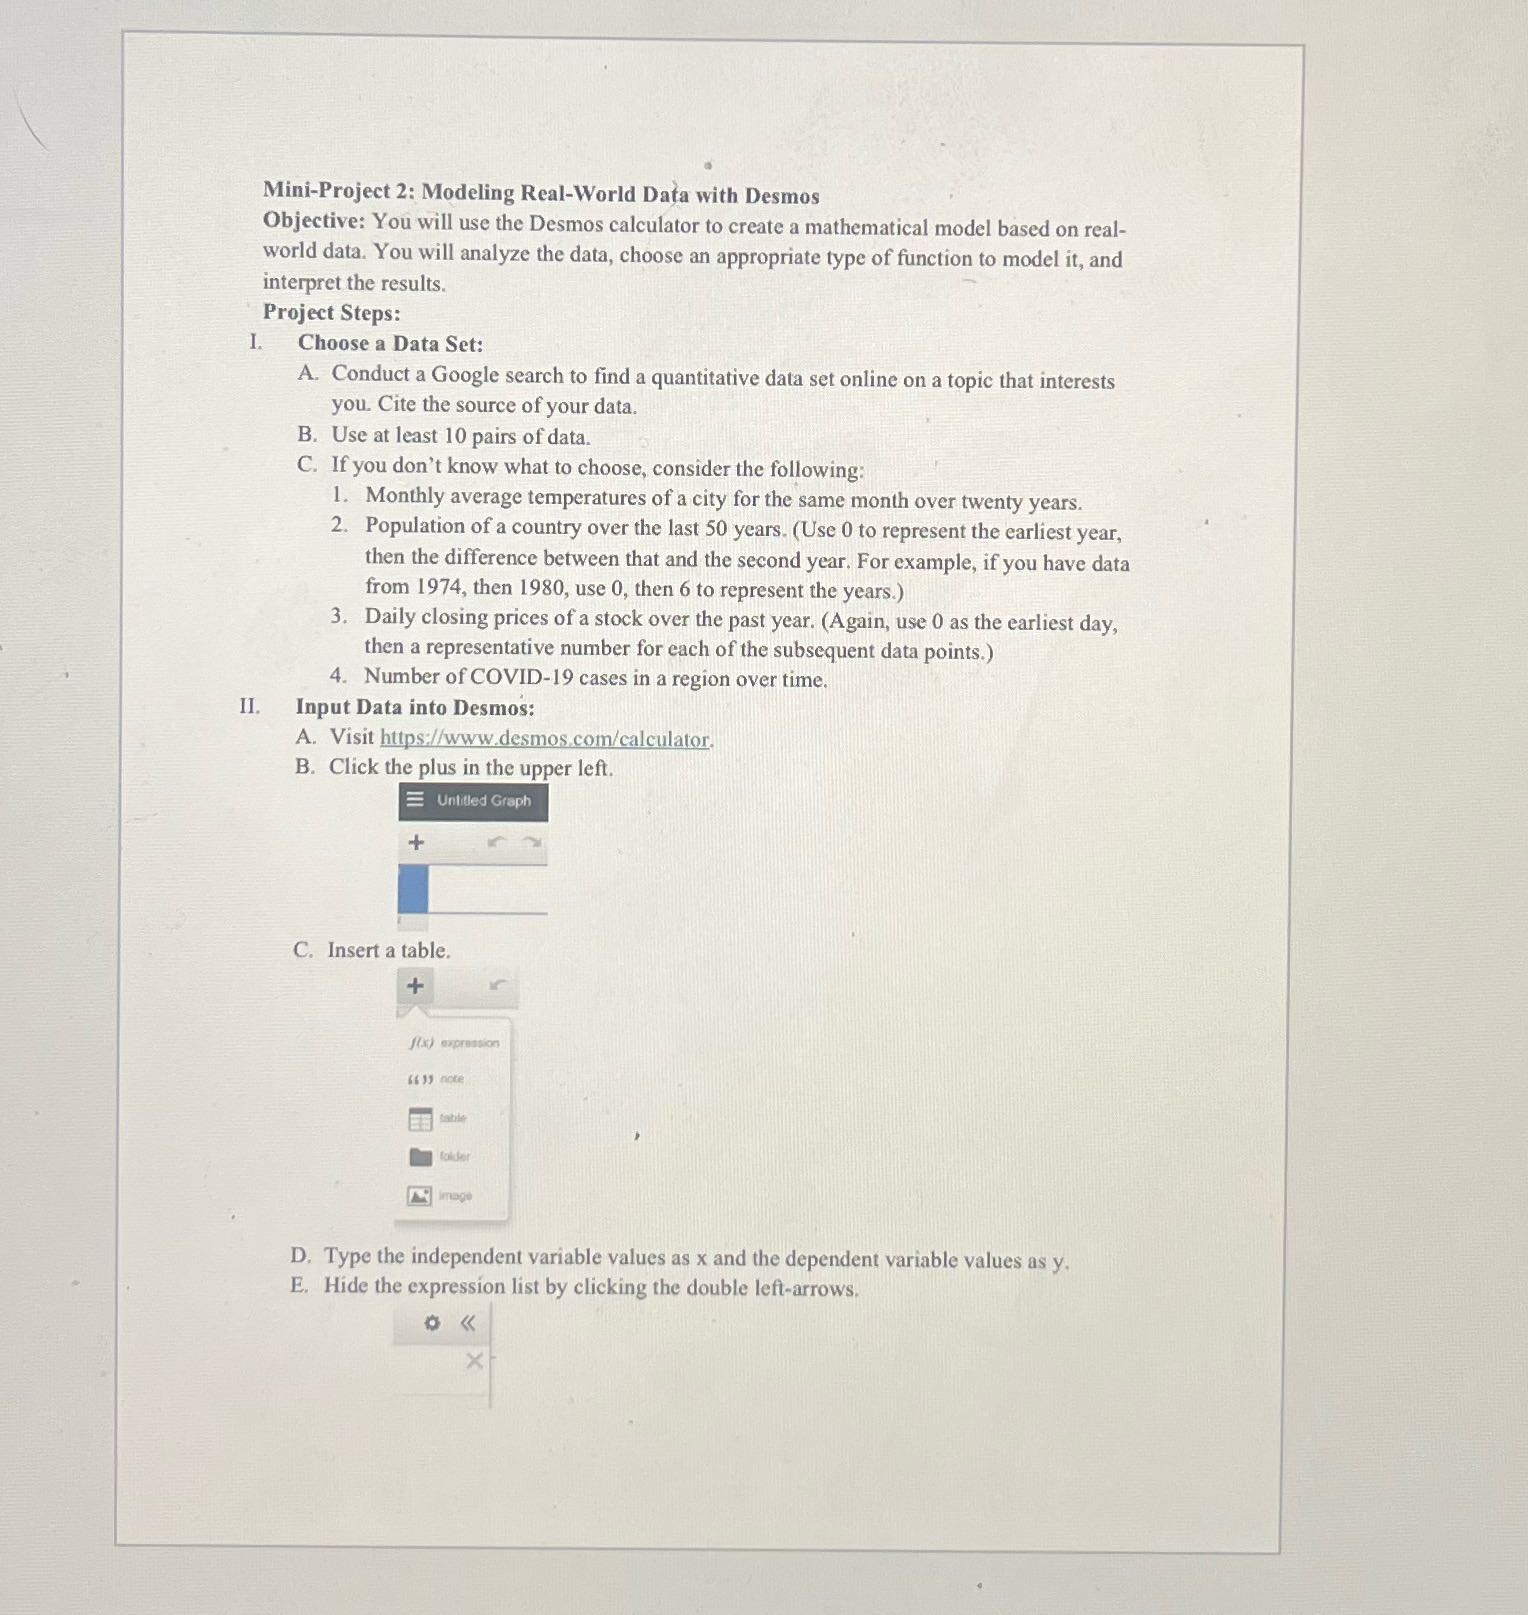
Question: Mini-Project 2: Modeling Real-World Data with Desmos Objective: You will use the Desmos calculator to create a mathematical model based on real- world data. You

Mini-Project 2: Modeling Real-World Data with
Mini-Project 2: Modeling Real-World Data with Desmos Objective: You will use the Desmos calculator to create a mathematical model based on real- world data. You will analyze the data, choose an appropriate type of function to model it, and interpret the results. Project Steps: I. Choose a Data Set: A. Conduct a Google search to find a quantitative data set online on a topic that interests you. Cite the source of your data. B. Use at least 10 pairs of data. C. If you don't know what to choose, consider the following: 1. Monthly average temperatures of a city for the same month over twenty years. 2. Population of a country over the last 50 years. (Use 0 to represent the earliest year, then the difference between that and the second year. For example, if you have data from 1974, then 1980, use 0, then 6 to represent the years.) 3. Daily closing prices of a stock over the past year. (Again, use 0 as the earliest day, then a representative number for each of the subsequent data points.) 4. Number of COVID-19 cases in a region over time. II. Input Data into Desmos: A. Visit https://www.desmos.com/calculator. B. Click the plus in the upper left. Untitled Graph C. Insert a table. + ((3) expression 64 13 note folder image D. Type the independent variable values as x and the dependent variable values as y. E. Hide the expression list by clicking the double left-arrows. X

Step by Step Solution

There are 3 Steps involved in it

1 Expert Approved Answer
Step: 1 Unlock blur-text-image
Question Has Been Solved by an Expert!

Get step-by-step solutions from verified subject matter experts

Step: 2 Unlock
Step: 3 Unlock

Students Have Also Explored These Related Accounting Questions!