

Question: MINITAB Application To establish the control chart, 30 samples of n=50 cans each were selected at half-hour intervals over a three-shift period in which the
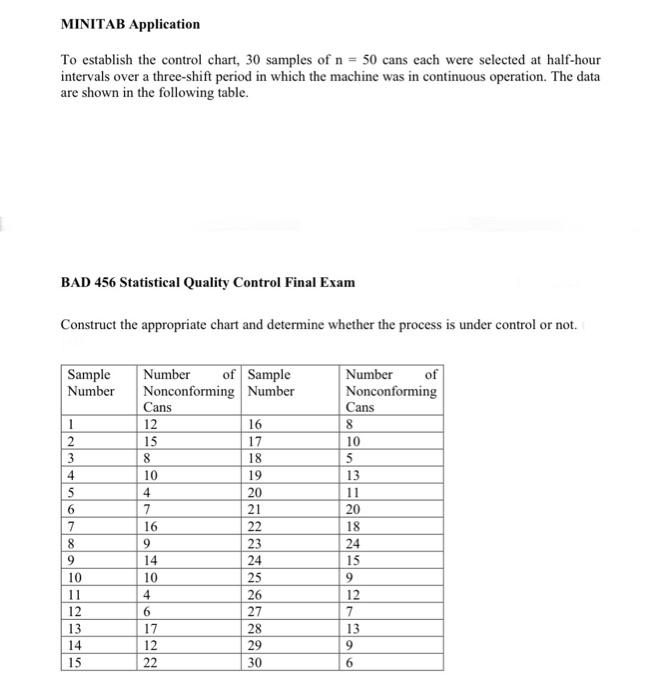
MINITAB Application To establish the control chart, 30 samples of n=50 cans each were selected at half-hour intervals over a three-shift period in which the machine was in continuous operation. The data are shown in the following table. BAD 456 Statistical Quality Control Final Exam Construct the appropriate chart and determine whether the process is under control or not
Step by Step Solution
There are 3 Steps involved in it
1 Expert Approved Answer
Step: 1 Unlock

Question Has Been Solved by an Expert!
Get step-by-step solutions from verified subject matter experts
Step: 2 Unlock
Step: 3 Unlock