

Question: Minitab Assignment. Dummy Input utilized. The data could not be placed here due to the restraint of how long the data shows on Chegg. Data:
Minitab Assignment. Dummy Input utilized.
The data could not be placed here due to the restraint of how long the data shows on Chegg.
Data: http://www.mediafire.com/file/yg56grptemz1a3p/scores.txt/file
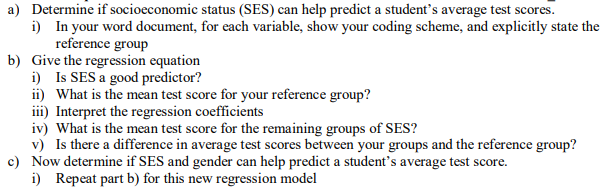
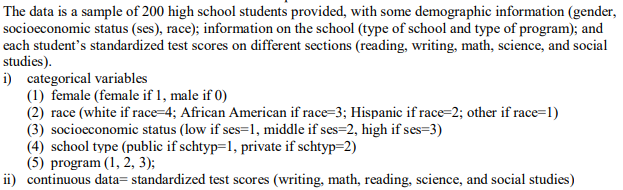
The data is a sample of 200 high school students provided, with some demographic information (gender, socioeconomic status (ses), race); information on the school (type of school and type of program); and each student's standardized test scores on different sections (reading, writing, math, science, and social studies). i) categorical variables (2) race (white if race-4; African American if race-3; Hispanic if race-2; other if race-1) (3) socioeconomic status (low if ses-1, middle if ses-2, high if ses-3) (4) school type (public if schtyp-1, private if schtyp-2) (5) program (1, 2, 3); ii) continuous data- standardized test scores (writing, math, reading, science, and social studies) a) Determine if socioeconomic status (SES) can help predict a student's average test scores i) In your word document, for each variable, show your coding scheme, and explicitly state the reference group b) Give the regression equation i) Is SES a good predictor? ii) What is the mean test score for your reference group? ii) Interpret the regression coefficients iv) What is the mean test score for the remaining groups of SES? v) Is there a difference in average test scores between your groups and the reference group? Now determine if SES and gender can help predict a student's average test score. i) c) Repeat part b) for this new regression model The data is a sample of 200 high school students provided, with some demographic information (gender, socioeconomic status (ses), race); information on the school (type of school and type of program); and each student's standardized test scores on different sections (reading, writing, math, science, and social studies). i) categorical variables (2) race (white if race-4; African American if race-3; Hispanic if race-2; other if race-1) (3) socioeconomic status (low if ses-1, middle if ses-2, high if ses-3) (4) school type (public if schtyp-1, private if schtyp-2) (5) program (1, 2, 3); ii) continuous data- standardized test scores (writing, math, reading, science, and social studies) a) Determine if socioeconomic status (SES) can help predict a student's average test scores i) In your word document, for each variable, show your coding scheme, and explicitly state the reference group b) Give the regression equation i) Is SES a good predictor? ii) What is the mean test score for your reference group? ii) Interpret the regression coefficients iv) What is the mean test score for the remaining groups of SES? v) Is there a difference in average test scores between your groups and the reference group? Now determine if SES and gender can help predict a student's average test score. i) c) Repeat part b) for this new regression model
Step by Step Solution
There are 3 Steps involved in it

Get step-by-step solutions from verified subject matter experts