

Question: Misleading statistics refer to data points, figures, or visual representations that are inaccurate, false, or manipulated to convey a distorted or biased message. They often
Misleading statistics refer to data points, figures, or visual representations that are inaccurate, false, or manipulated to convey a distorted or biased message. They often arise from errors or biases in the collection, organization, or presentation of data.
Misleading statistics can lead to incorrect conclusions, poor decision-making, and a false sense of confidence in certain beliefs or assumptions. Common ways that statistics can be misleading include selective bias, neglected sample size, faulty correlations, and causations, and the use of manipulative graphs and visuals.
Misleading statistics are created when a fault - deliberate or not - is present in one of the three key aspects of research:
- Collecting:Using small sample sizes that project big numbers but have little statistical significance.
- Organizing:Omitting findings that contradict the point the researcher is trying to prove.
- Presenting:Manipulating visualumerical data to influence perception.
Ways to safeguard yourself against misleading data by asking these questions.
Who is doing the research? Research is expensive and time-consuming. Check who is sponsoring it, weigh their bias on the topic, and how they might benefit from results. Are they a Business to Consumer company with a product? A consulting service? An independent university-funded study? What is their motive, should they have one?
Can sample size and study length be identified and/or taken seriously? Inspecting the supporting or veiled numbers will expose weak statistical strength.
Are data visuals represented fairly? Are the scales and intervals evenly spaced and neutral? Is a statistic pushing a specific idea or agenda? Are there too many metrics in your dashboard?
Is the research represented honestly and in an impartial manner? Review the language used, the way the question is framed, and the people being surveyed. To prevent misleading statistics and data from polluting your dashboards, reports, and analytics, greet new information with a curious and skeptical attitude.
For this discussion you are to:
- Search for statistical data in the real world.
- Identify and describe some of the potential biases from the categories discussed above.
- Collecting
- Organizing
- Presenting
- Explain if you feel this information was deliberately misused and why.
- Reflect and discuss what you have found, and the topics presented earlier regarding ways that you can safeguard yourself against misleading data.
- Include an image, video, or article of where your statistical data was found.
I would suggest that you choose an area that you have some connection to or interest in. However, if you are feeling stuck, here are some possible industries to search:
- Food and Beverage
- Medical
- Politics
- Journalism
- Sales
- Look in physical stores.
- Look on the TV, internet, newspaper.
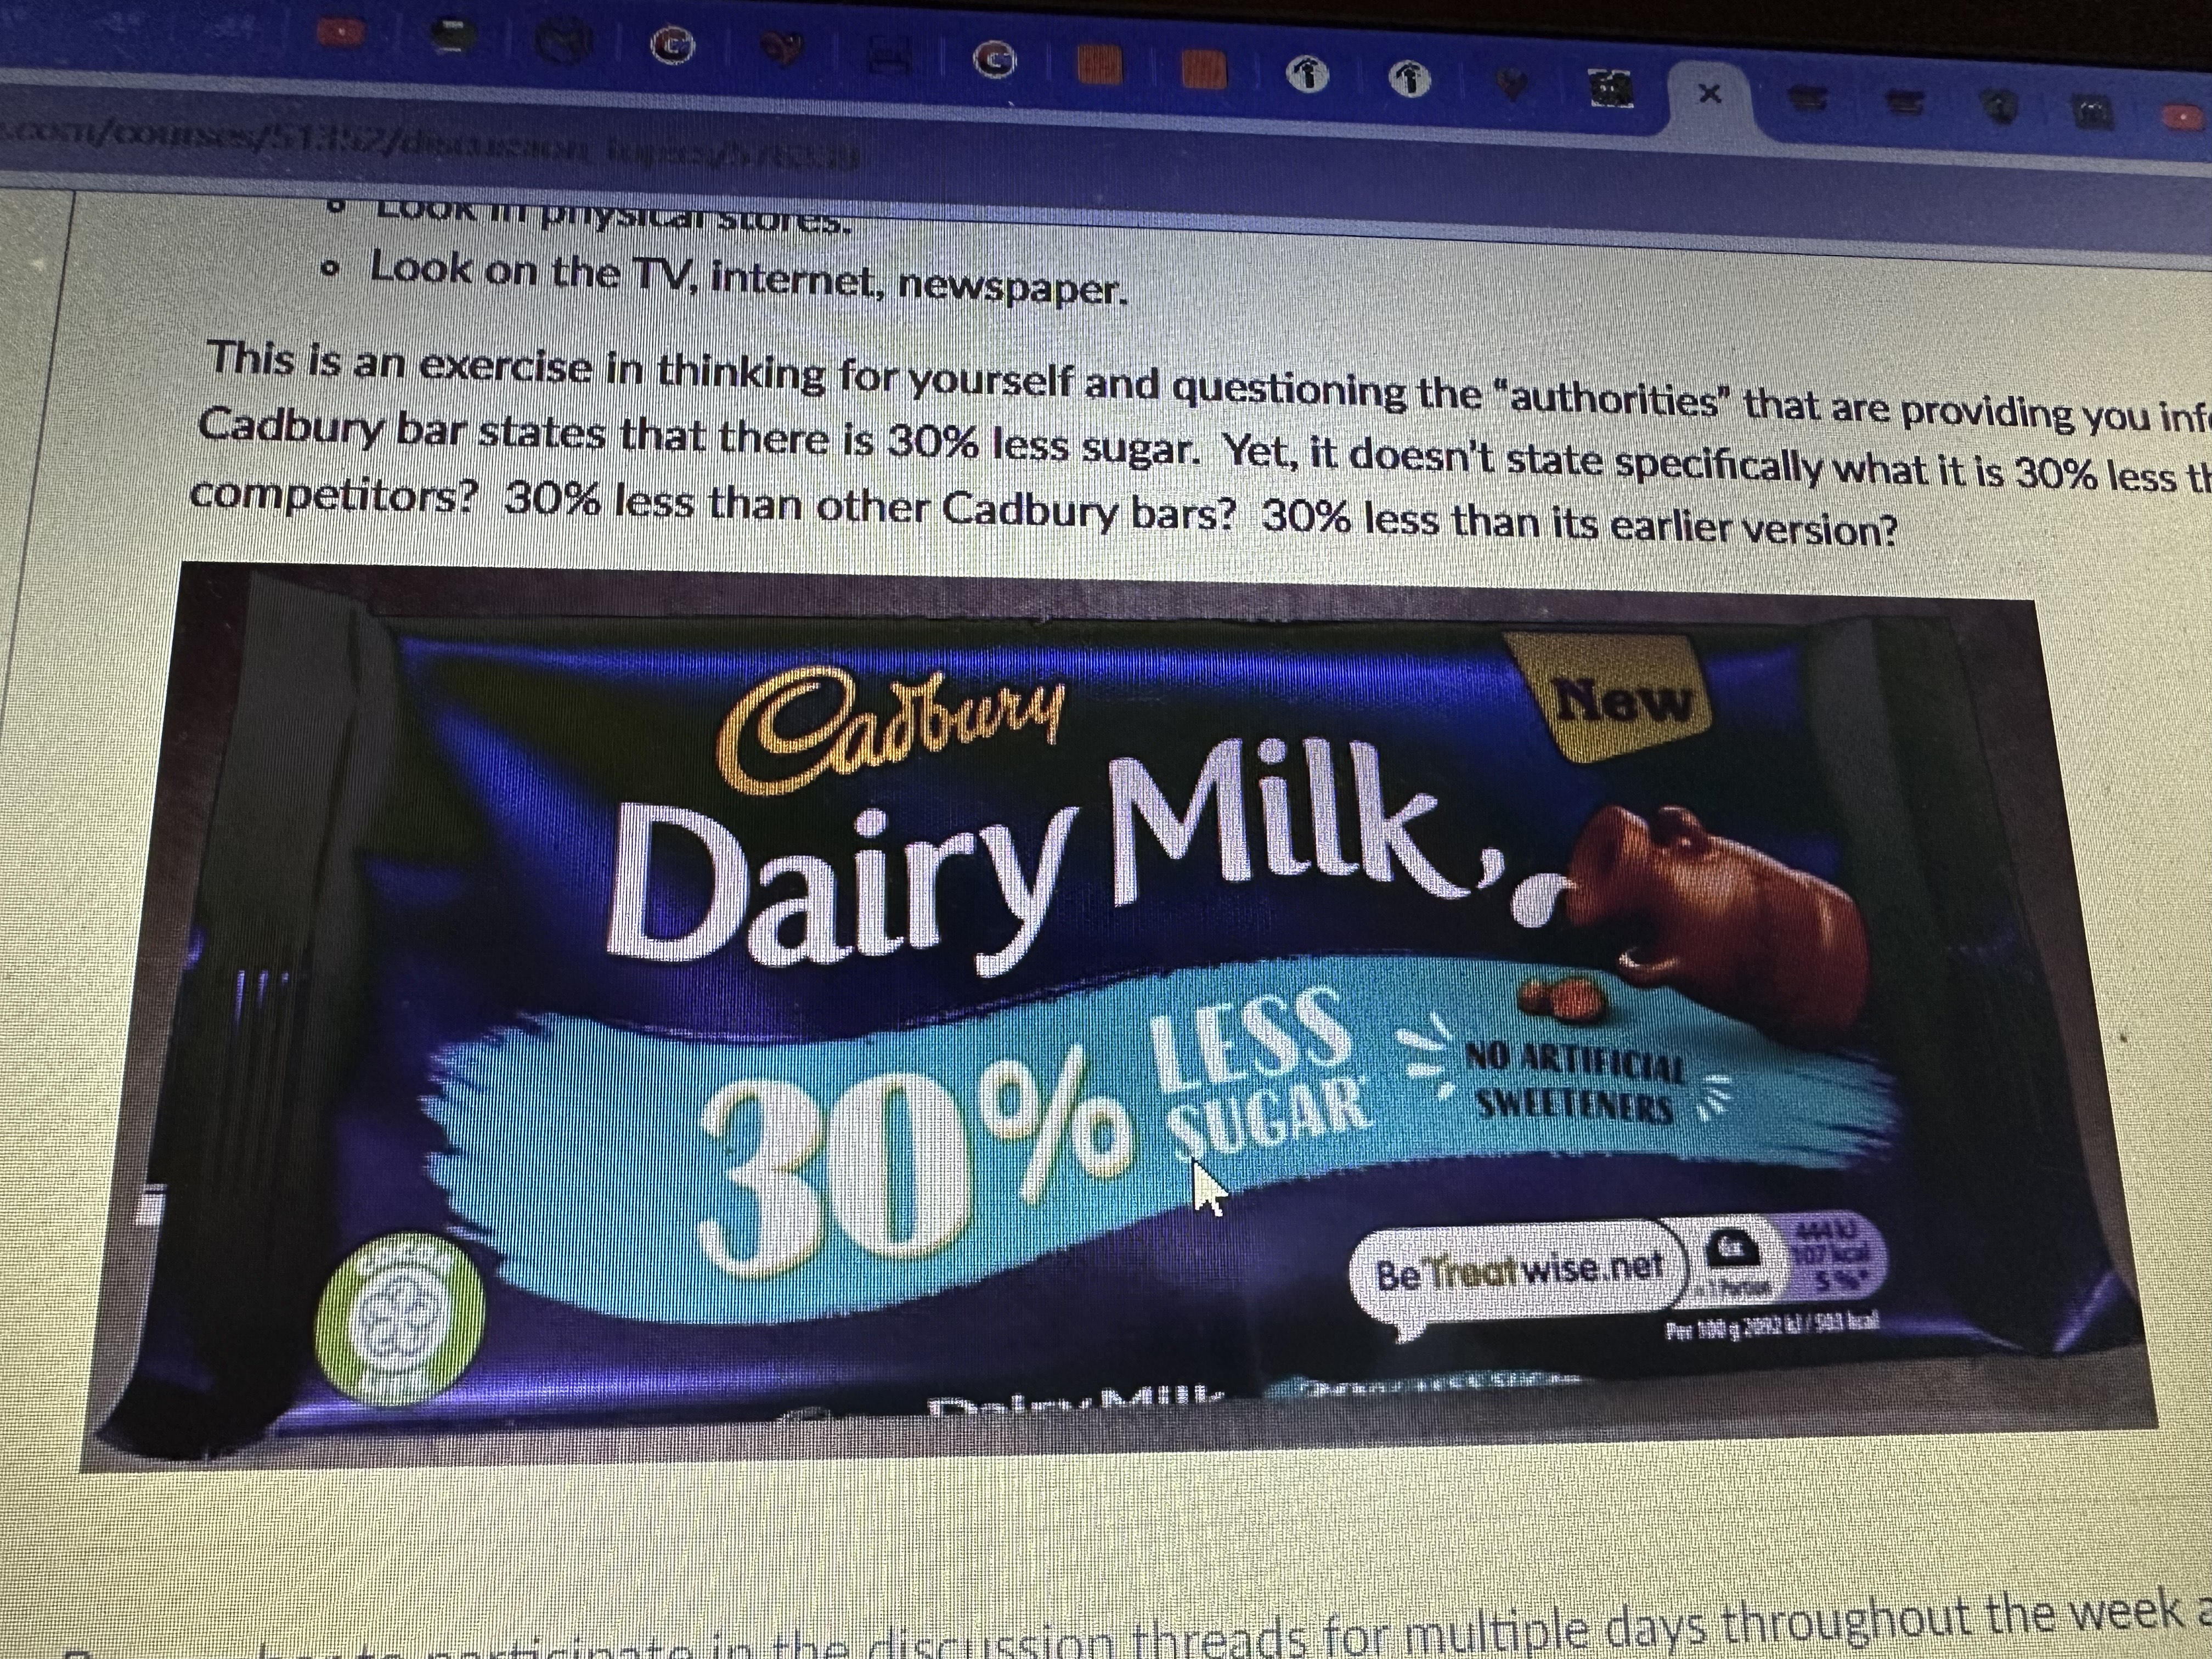
This is an exercise in thinking for yourself and questioning the "authorities" that are providing you information. For example, this Cadbury bar states that there is 30% less sugar. Yet, it doesn't state specifically what it is 30% less than. Is it 30% less than its competitors? 30% less than other Cadbury bars? 30% less than its earlier version?
Step by Step Solution
There are 3 Steps involved in it

Get step-by-step solutions from verified subject matter experts