

Question: Model 4: OLS, using observations 1-1236 (n = 1234) Missing or incomplete observations dropped: 2 Dependent variable: PerCapitaInc coefficient std. error t-ratio p-value const 37703.1
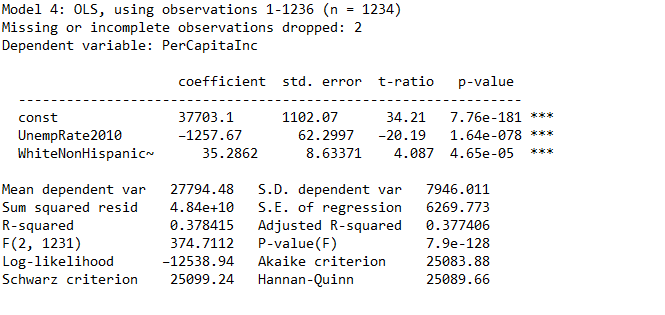
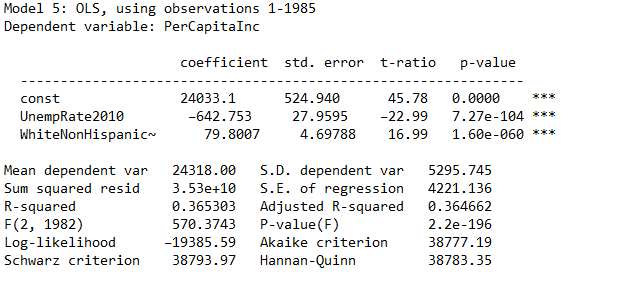
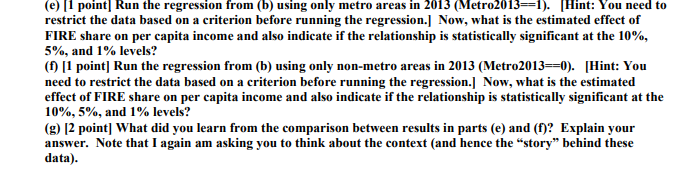
Model 4: OLS, using observations 1-1236 (n = 1234) Missing or incomplete observations dropped: 2 Dependent variable: PerCapitaInc coefficient std. error t-ratio p-value const 37703.1 1102.07 34 . 21 7.76e-181 UnempRate2010 -1257.67 62. 2997 -20.19 1.64e-078 WhiteNonHispanic~ 35 . 2862 8.63371 4.087 4.65e-05 Mean dependent var 27794 .48 S.D. dependent var 7946. 011 Sum squared resid 4.84e+10 S. E. of regression 6269.773 R-squared 0. 378415 Adjusted R-squared 0. 377406 F(2, 1231) 374. 7112 P-value(F) 7.9e-128 Log-likelihood -12538.94 Akaike criterion 25083 .88 Schwarz criterion 25099 . 24 Hannan-Quinn 25089.66Model 5: OLS, using observations 1-1985 Dependent variable: PerCapitaInc coefficient std. error t-ratio p-value const 24033.1 524.940 45.78 0. 0000 UnempRate2010 -642.753 27.9595 -22.99 7.27e-104 WhiteNonHispanic 79 . 8007 4. 69788 16.99 1.60e-060 Mean dependent var 24318.00 S.D. dependent var 5295.745 Sum squared resid 3.53e+10 S. E. of regression 4221.136 R-squared 0. 365303 Adjusted R-squared 0. 364662 F(2, 1982) 570.3743 P-value(F) 2. 2e-196 Log-likelihood -19385.59 Akaike criterion 38777.19 Schwarz criterion 38793.97 Hannan-Quinn 38783.35(e) [1 point] Run the regression from (b) using only metro areas in 2013 (Metro2013=1). Hint: You need to restrict the data based on a criterion before running the regression.] Now, what is the estimated effect of FIRE share on per capita income and also indicate if the relationship is statistically significant at the 10%, 5%, and 1% levels? (f) [1 point] Run the regression from (b) using only non-metro areas in 2013 (Metro2013==0). [Hint: You need to restrict the data based on a criterion before running the regression.] Now, what is the estimated effect of FIRE share on per capita income and also indicate if the relationship is statistically significant at the 10%, 5%, and 1% levels? (g) [2 point] What did you learn from the comparison between results in parts (e) and (f)? Explain your answer. Note that I again am asking you to think about the context (and hence the "story" behind these data)
Step by Step Solution
There are 3 Steps involved in it

Get step-by-step solutions from verified subject matter experts