

Question: model and simulating Assignment 1 Problem 1 (explore the data, 40 points); In this exercise use the Peruvian blood pressure data set, provided in the
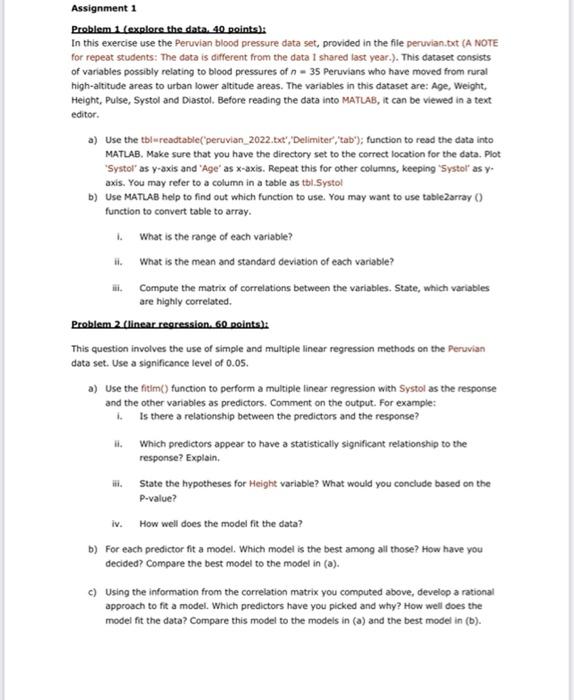
Assignment 1 Problem 1 (explore the data, 40 points); In this exercise use the Peruvian blood pressure data set, provided in the file peruvian.txt (A NOTE for repeat students: The data is different from the data 1 shared last year.). This dataset consists of variables possibly relating to blood pressures of n - 35 Peruvians who have moved from rural high-altitude areas to urban lower altitude areas. The variables in this dataset are: Age, Weight Height, Pulse, Systol and Diastol. Before reading the data into MATLAB, it can be viewed in a text editor. . . a) Use the breadtable("peruvian_2022.txt", "Delimiter, tab"); function to read the data into MATLAB. Make sure that you have the directory set to the correct location for the data. Plot "Systol as y-axis and "Age" as x-axis. Repeat this for other columns, keeping "Systolas y axis. You may refer to a column in a table as tbl.Systol b) Use MATLAB help to find out which function to use. You may want to use table array function to convert table to array. What is the range of each variable? What is the mean and standard deviation of each variable? H. Compute the matrix of correlations between the variables. State, which variables are highly correlated Problem 2 (linear regression. 60 points); This question involves the use of simple and multiple linear regression methods on the Peruvian data set. Use a significance level of 0.05. a) Use the fitim() function to perform a multiple linear regression with Systol as the response and the other variables as predictors. Comment on the output. For example: Is there a relationship between the predictors and the response? Which predictors appear to have a statistically significant relationship to the response? Explain State the hypotheses for Height variable? What would you conclude based on the P-value? iv. How well does the model fit the data? b) for each predictor fit a model. Which model is the best among all those? How have you decided? Compare the best model to the model in (). c) Using the information from the correlation matrix you computed above, develop a rational approach to fit a model. Which predictors have you picked and why? How well does the model fit the data? Compare this model to the models in () and the best model in (b)
Step by Step Solution
There are 3 Steps involved in it

Get step-by-step solutions from verified subject matter experts