

Question: Model : Bivariate - Scatterplot and Histogram for Correlation of all Opioid Overdose Deaths in comparison To Medium - Small Metropolitan Areas from* 1995 -
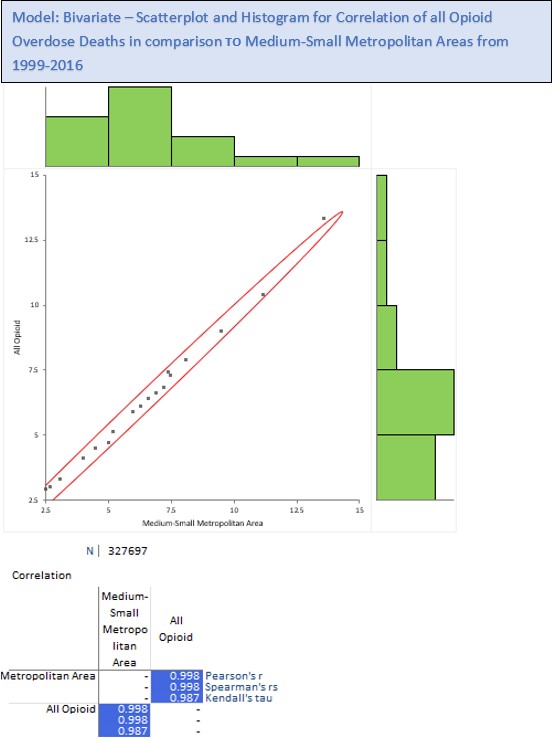
Model : Bivariate - Scatterplot and Histogram for Correlation of all Opioid Overdose Deaths in comparison To Medium - Small Metropolitan Areas from* 1995 - 2015 15. $15 10 All Oftold 75 15 75 125 15 Medium. Small WEENIE Faltan Area N / 327697 Correlation Medium- Small Metropol All litan Opioid AREE Metropolitan Area ``` Pearson's r JEFF` Spearman's 15 1)` Kendall's tau All Opioid
Step by Step Solution
There are 3 Steps involved in it
1 Expert Approved Answer
Step: 1 Unlock

Question Has Been Solved by an Expert!
Get step-by-step solutions from verified subject matter experts
Step: 2 Unlock
Step: 3 Unlock