

Question: Model F1 was next generalized to include a second order interaction term: Stay2XRay. Fig 2 Call: 1m ( formula = infrisk ~ stay + xray
- Model F1 was next generalized to include a second order interaction term: Stay2XRay. Fig 2
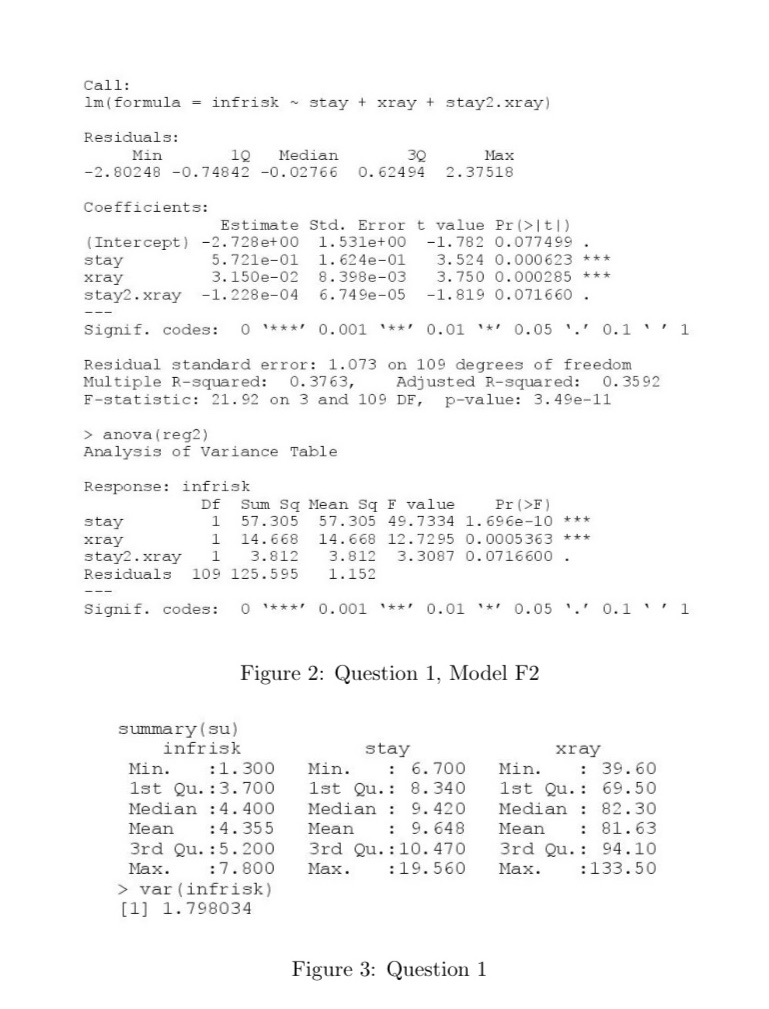
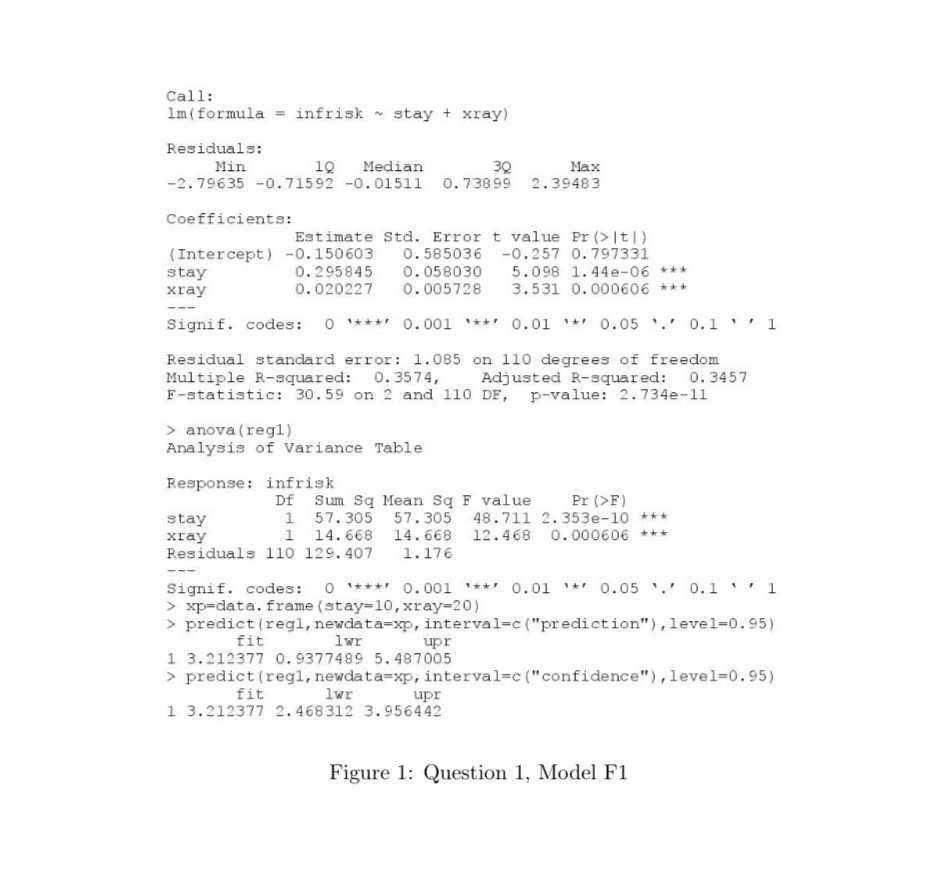
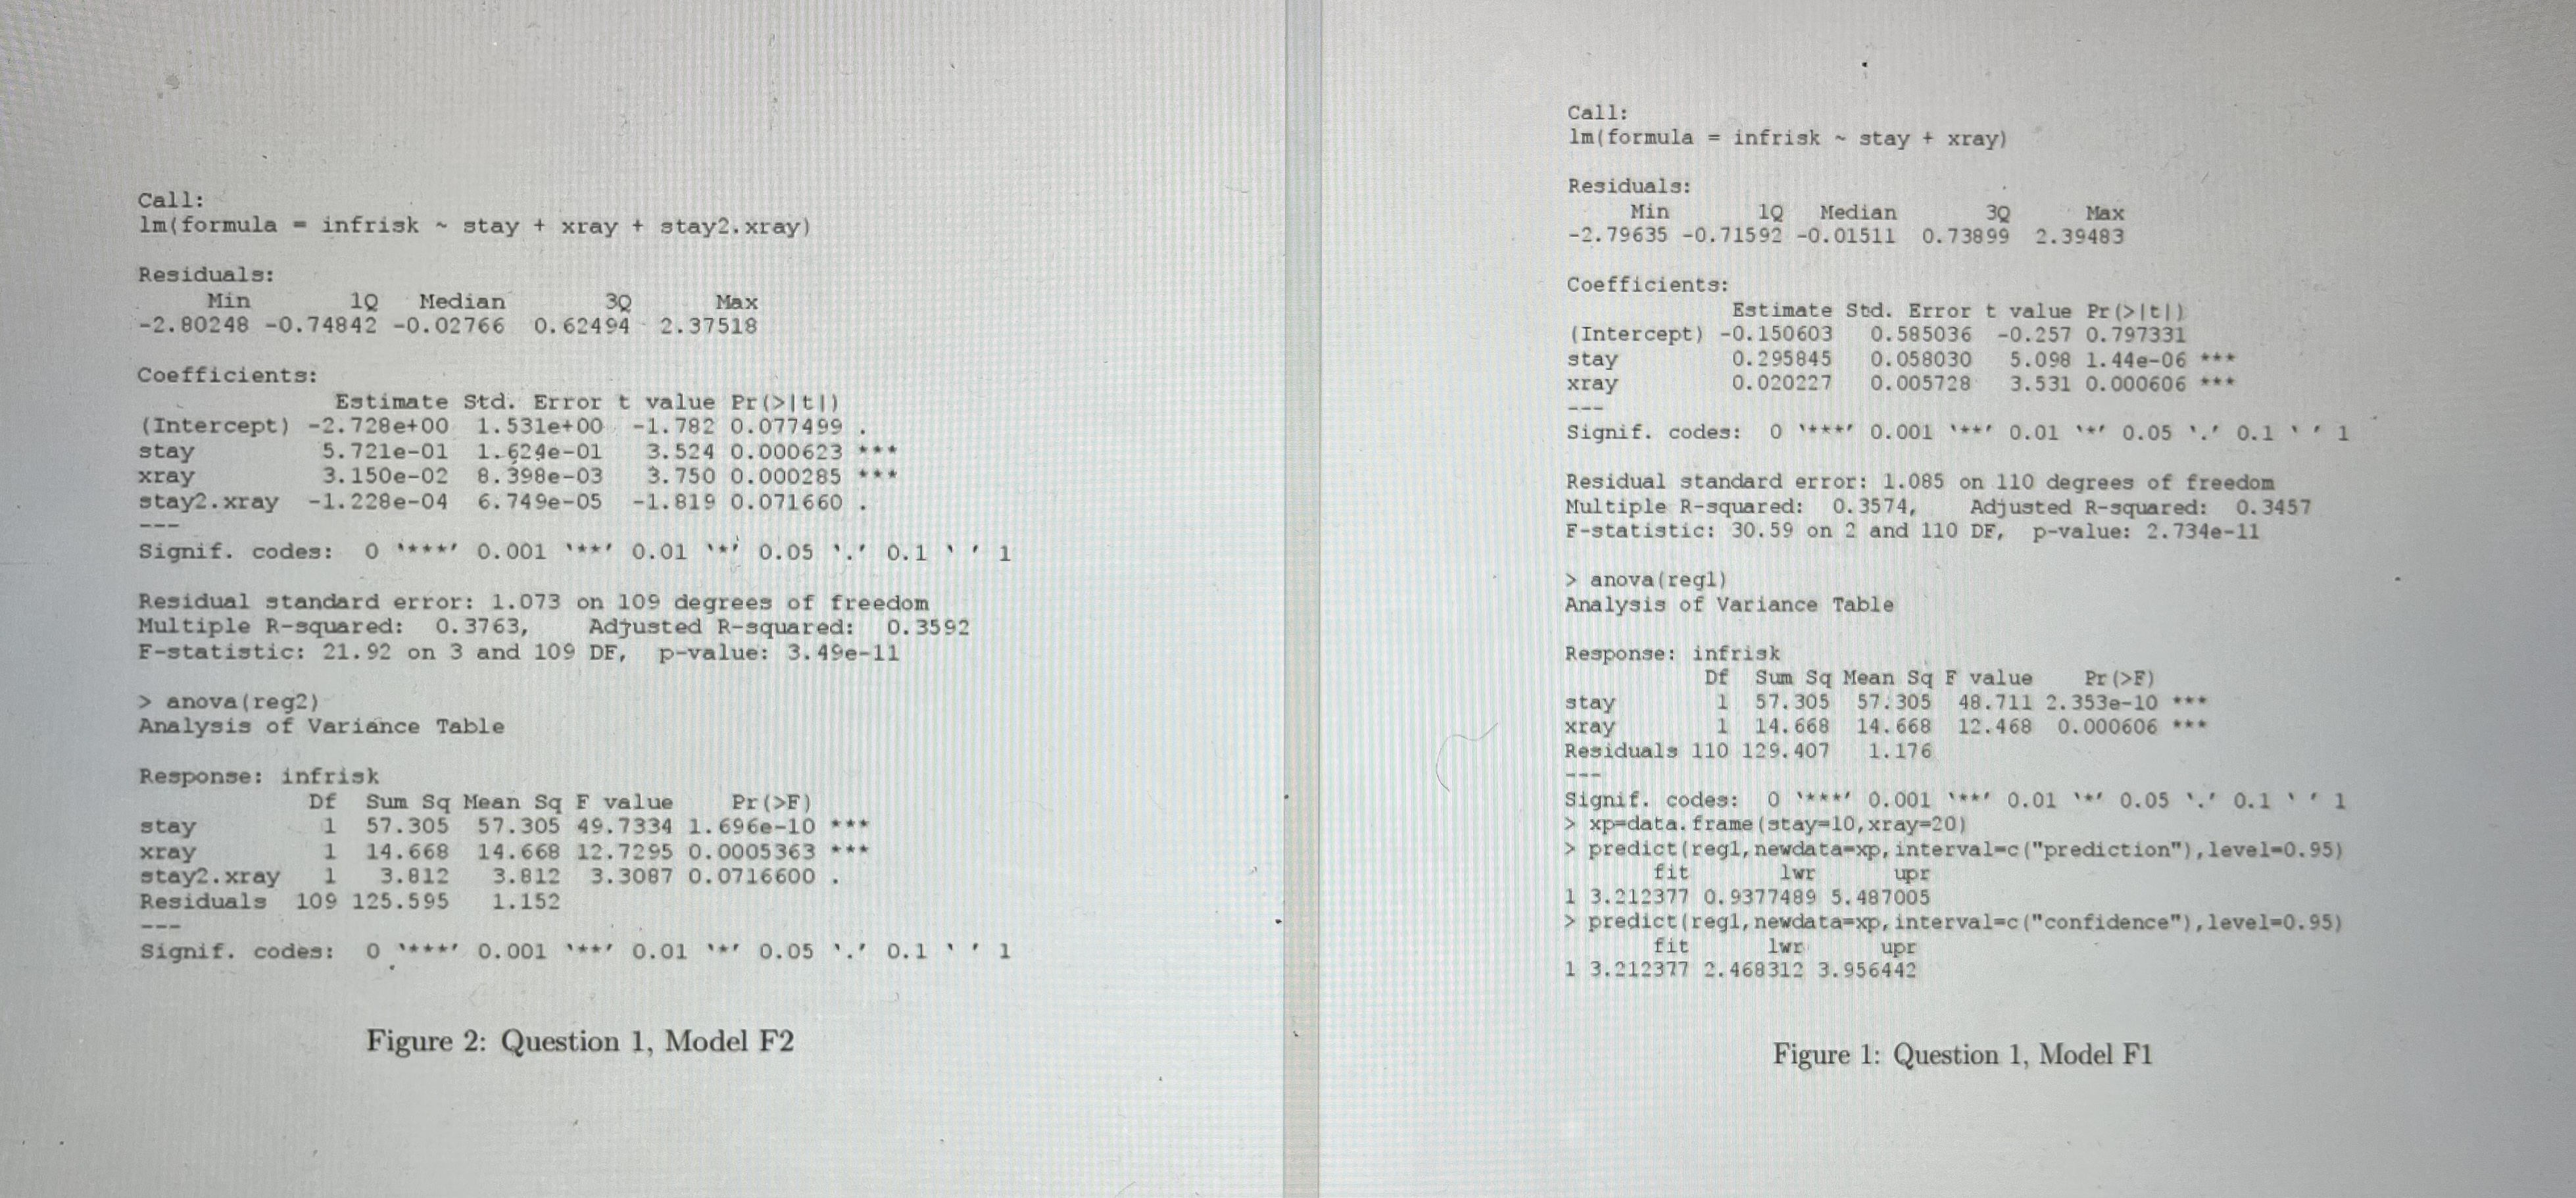
Call: 1m ( formula = infrisk ~ stay + xray + stay2. xray) Residuals: Min Median 30 Max -2. 80248 -0. 74842 -0. 02766 0. 62494 2.37518 Coefficients: Estimate Std. Error t value Pr (>|t/) (Intercept ) -2. 728e+00 1. 531e+00 -1. 782 0. 077499 stay 5. 721e-01 1. 624e-01 3. 524 0. 000623 * * * xray 3. 150e-02 8. 398e-03 3. 750 0. 000285 * * * stay2 . xray -1. 228e-04 6. 749e-05 -1. 819 0. 071660 . Signif. codes: 0 * *#' 0. 001 * **' 0.01 * * 0.05 . . ' 0.1 " * 1 Residual standard error: 1.073 on 109 degrees of freedom Multiple R-squared: 0. 3763, Adjusted R-squared: 0. 3592 F-statistic: 21. 92 on 3 and 109 DF, p-value: 3. 49e-11 > anova (reg2) Analysis of Variance Table Response: infrisk Df Sum Sq Mean Sq F value Pr (>F) stay 1 57. 305 57. 305 49. 7334 1. 696e-10 * * * xray 1 14. 668 14. 668 12. 7295 0. 0005363 * * * stay2. xray 1 3. 812 3. 812 3. 3087 0. 0716600 Residuals 109 125.595 1. 152 Signif. codes: 0 * * *#' 0.001 * *#* 0.01 * * 0.05 . . ' 0.1 * * 1 Figure 2: Question 1, Model F2 summary (su) infrisk stay xray Min. : 1. 300 Min. : 6. 700 Min. 39. 60 1st Qu. : 3. 700 1st Qu. : 8. 340 1st Qu. : 69. 50 Median : 4. 400 Median : 9. 420 Median : 82.30 Mean : 4. 35 5 Mean 9. 648 Mean : 81. 63 3rd Qu. : 5. 200 3rd Qu. : 10. 470 3rd Qu. : 94.10 Max. : 7 . 800 Max. : 19. 560 Max. : 133. 50 > var (infrisk) [1] 1. 798034 Figure 3: Question 1Call: Im (formula = infrisk ~ stay + xray) Residuals: Min 1Q Median 30 Max -2. 79635 -0. 71592 -0. 01511 0. 73899 2. 39483 Coefficients: Estimate Std. Error t value Pr (> |t|) (Intercept ) -0. 150603 0. 585036 -0. 257 0. 797331 stay 0. 295845 0. 058030 5. 098 1. 44e-06 * * * xray 0. 020227 0. 005728 3. 531 0. 000606 * * Signif. codes: 0 * *#' 0. 001 * ** 0.01 * * 0.05 . . ' 0.1 . . Residual standard error: 1.085 on 110 degrees of freedom Multiple R-squared: 0. 3574, Adjusted R-squared: 0. 3457 F-statistic: 30.59 on 2 and 110 DF, p-value: 2. 734e-11 > anova (regl) Analysis of Variance Table Response: infrisk Df Sum Sq Mean Sq F value Pr (>F) stay 57. 305 57. 305 48. 711 2. 353e-10 * * * xray 1 14. 668 14. 668 12. 468 0. 000606 * * * Residuals 110 129. 407 1. 176 Signif. codes: 0 '*** 0. 001 \\**/ 0.01 * * 0.05 . .' 0.1 ' ' 1 xp=data. frame (stay=10, xray=20) > predict (regl, newdata=xp, interval=c ("prediction") , level=0. 95) fit 1wr adn 1 3. 212377 0. 9377489 5. 487005 > predict (regl, newdata=xp, interval=c ("confidence") , level=0. 95) fit 1wr upr 1 3. 212377 2. 468312 3. 956442 Figure 1: Question 1, Model F1Call: Im ( formula = infrisk ~ stay + xray) Residuals: Call: Min 1Q Median 3Q Max Im ( formula = infrisk ~ stay + xray + stay2. xray) -2. 79635 -0. 71592 -0. 01511 0. 73899 2. 39483 Residuals: Coefficients: Min 10 Median 3Q Max Estimate Std. Error t value Pr (> [t|) -2. 80248 -0. 74842 -0. 02766 0. 62494 2. 37518 (Intercept) -0. 150603 0. 585036 -0.257 0. 797331 stay 0. 295845 0. 058030 5. 098 1. 44e-06 * * Coefficients: xray 0. 020227 0. 005728 3. 531 0. 000606 * *+ Estimate Std. Error t value Pr (>It| ) (Intercept ) -2. 728e+00 1. 531e+00 -1. 782 0.077499 Signif. codes: 0 ** 0. 001 .**' 0.01 .* 0.05 . .' 0.1 . . 1 stay 5. 721e-01 1. 624e-01 3. 524 0. 000623 +.* xray 3. 150e-02 8. 398e-03 3. 750 0. 000285 . Residual standard error: 1.085 on 110 degrees of freedom stay2 . xray -1. 228e-04 6. 749e-05 -1. 819 0. 071660 Multiple R-squared: 0. 3574, Adjusted R-squared: 0. 3457 F-statistic: 30.59 on 2 and 110 DF, p-value: 2. 734e-11 Signif. codes: 0 ***' 0. 001 .**' 0.01 +' o.05 .. 0. 1 . . > anova (reg1) Residual standard error: 1.073 on 109 degrees of freedom Analysis of Variance Table Multiple R-squared: 0. 3763, Adjusted R-squared: 0. 3592 F-statistic: 21. 92 on 3 and 109 DF, p-value: 3. 49e-11 Response: infrisk Df Sum Sq Mean Sq F value Pr (>F) > anova (reg2) stay 57. 305 57. 305 48 . 711 2. 353e-10 ** * Analysis of Variance Table xray 14. 668 14. 668 12. 468 0. 000606 ** * Residuals 110 129. 407 1. 176 Response: infrisk Df Sum Sq Mean Sq F value Pr (>F) Signif. codes: 0 * * *' 0. 001 **' 0.01 .*' 0.05 . .' 0.1 . . 1 stay 57. 305 57. 305 49. 7334 1. 696e-10 * ** > xp-data. frame (stay=10, xray=20) xray 14. 668 14. 668 12. 7295 0. 0005363 * * * > predict (regl, newdata-xp, interval-c ("prediction") , level-0. 95) stay2 . xray 3. 812 3. 812 3. 3087 0. 0716600 fit 1wr upr Residuals 109 125.595 1. 152 1 3. 212377 0. 9377489 5. 487005 > predict (regl, newdata-xp, interval=c ("confidence") , level=0. 95) Signif. codes: 0 14* *' 0. 001 .**' 0.01 .#' 0. 05 . .' 0.1 ' ' 1 fit 1wr upr 1 3. 212377 2. 468312 3. 956442 Figure 2: Question 1, Model F2 Figure 1: Question 1, Model F1
Step by Step Solution
There are 3 Steps involved in it

Get step-by-step solutions from verified subject matter experts